Unlock a world of possibilities! Login now and discover the exclusive benefits awaiting you.
- Qlik Community
- :
- Forums
- :
- Analytics
- :
- New to Qlik Analytics
- :
- Re: How to use different filters on X and Y in a s...
- Subscribe to RSS Feed
- Mark Topic as New
- Mark Topic as Read
- Float this Topic for Current User
- Bookmark
- Subscribe
- Mute
- Printer Friendly Page
- Mark as New
- Bookmark
- Subscribe
- Mute
- Subscribe to RSS Feed
- Permalink
- Report Inappropriate Content
How to use different filters on X and Y in a scatter plot?
I have my data organised like shown below. I have previously used Excel for this type of evaluation, but am looking at Qlik Sense for another way of evaluating data. I am also looking at QlikView. The table is obviously significantly larger than shown below with a couple of hundred parameters. In Excel I used a slicer and pivot table to select the data and a dynamic scatter chart to display the selected data.
Index | Country | Parameter | Amount ($) |
1 | Australia | Revenue | 3656 |
2 | Australia | Profit | 2365 |
3 | Australia | Maintenance | 500 |
4 | Australia | Miscellaneous Expenses | 632 |
5 | United States | Revenue | 6965 |
6 | United States | Profit | 3326 |
X data could be extracted by: Value in Amount column (Filtered by Parameter)
Y data could be extracted by: Value in Amount column (Filtered by different Parameter to X)
Country could be used as a global filter for both axes.
Is it possible to prepare a Scatter plot for data in this format?
Thanks in advance for your help!
- Tags:
- filter
- scatterchart
- « Previous Replies
-
- 1
- 2
- Next Replies »
- Mark as New
- Bookmark
- Subscribe
- Mute
- Subscribe to RSS Feed
- Permalink
- Report Inappropriate Content
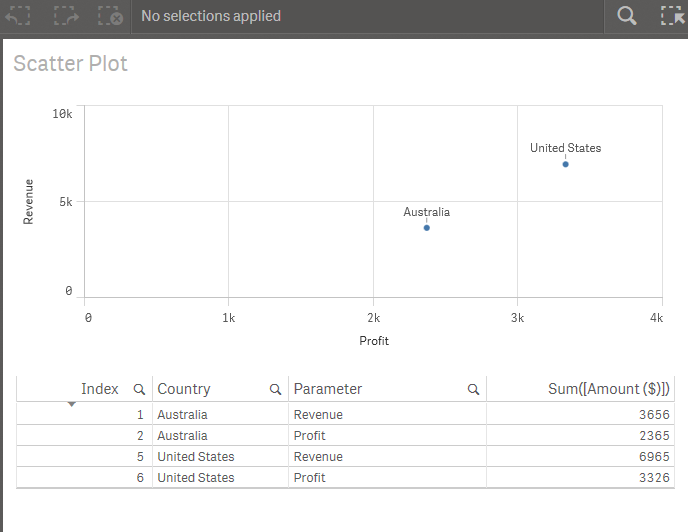
Yes you can achieve a Scatter Chart in QlikView and a Scatter Plot in Qlik Sense without doing any data transformation of your data by using Set Expressions within the charts expressions to single out X and Y values.
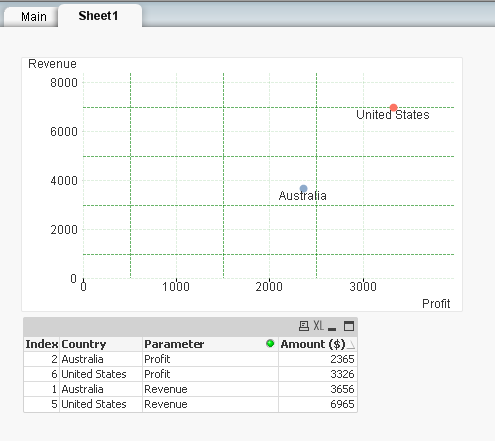
You pick Country as a dimension and select value twice as expression in QlikView and as measure in Qlik Sense - they expressions look like:
Profit (X):
Sum( {<Parameter={'Profit'}>} [Amount ($)] )
Revenue (Y):
Sum( {<Parameter={'Revenue'}>} [Amount ($)] )
- Mark as New
- Bookmark
- Subscribe
- Mute
- Subscribe to RSS Feed
- Permalink
- Report Inappropriate Content
Here are the sample apps in both QlikView and Qlik Sense...
- Mark as New
- Bookmark
- Subscribe
- Mute
- Subscribe to RSS Feed
- Permalink
- Report Inappropriate Content
Thanks for the information Petter.
So by adding an expression I can create a fixed scatter chart (can't change the parameter used for X or Y).
Is it possible to link the parameter used in the expression for X and Y to filter for X and a filter for Y?
This means I can change the Y or X Parameter to investigate correlations between the parameters. Don't forget, in the actual dataset, there are a couple of hundred different parameters.
- Mark as New
- Bookmark
- Subscribe
- Mute
- Subscribe to RSS Feed
- Permalink
- Report Inappropriate Content
Yes it is quite easy to extend this into a dynamic parameters for X and Y. You can even have X with a group of parameters and Y with another set of parameters. The number of distinct values in the parameter field shouldn't make
much difference. Or do you mean that there are a couple of hundred different field like the field Parameter?
There are a couple of ways to turn X and Y into dynamic: variables or listboxes using Alternate States.
- Mark as New
- Bookmark
- Subscribe
- Mute
- Subscribe to RSS Feed
- Permalink
- Report Inappropriate Content
OK. Is there an example or tutorial explaining how to allow dynamic parameters based on a filter for X and Y?
There is only one Parameters column which I want to use to filter for X and Y.
Does that makes sense?
- Mark as New
- Bookmark
- Subscribe
- Mute
- Subscribe to RSS Feed
- Permalink
- Report Inappropriate Content
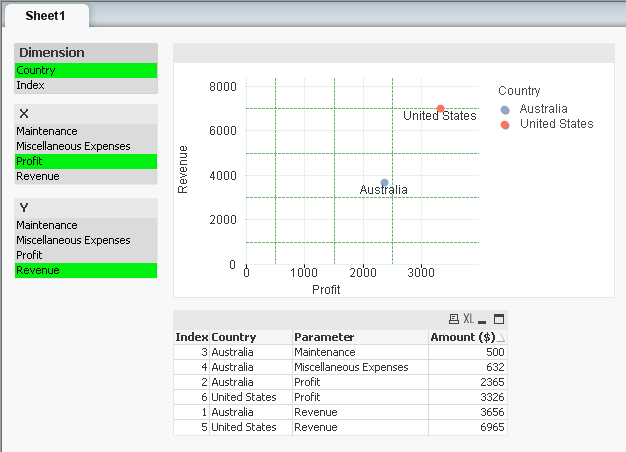
Here is the example for QlikView extended to have semi-dynamic dimension selection by using ENABLE CONDITION for each dimension by an expression like =MinString(Dimension)='Country' and having a Dimension table which contains the dimensions you want to be selectable.
For parameters one can use $-sign expansion together with the Concat() string aggregate function to allow for dynamic replacement of which parameters should go into X and Y. With Concat() you can have multiple parameters
for either X and/or Y. For X it would look like this:
Sum ({<Parameter={$(=Chr(39) & Concat(DISTINCT {asParameterX} Parameter,Chr(39)& ',' & Chr(39)) & Chr(39))}>} [Amount ($)])
(I know 😮 this looks pretty ugly)
For this to work you also have to declare two Alternate States - which I have called asParameterX and asParameterY. And I have put on two listboxes which have been assigned to each of the Alternate States with both referring to the field Parameter.
I might turn this into some kind of tutorial instead of this compact explanation.... later
- Mark as New
- Bookmark
- Subscribe
- Mute
- Subscribe to RSS Feed
- Permalink
- Report Inappropriate Content
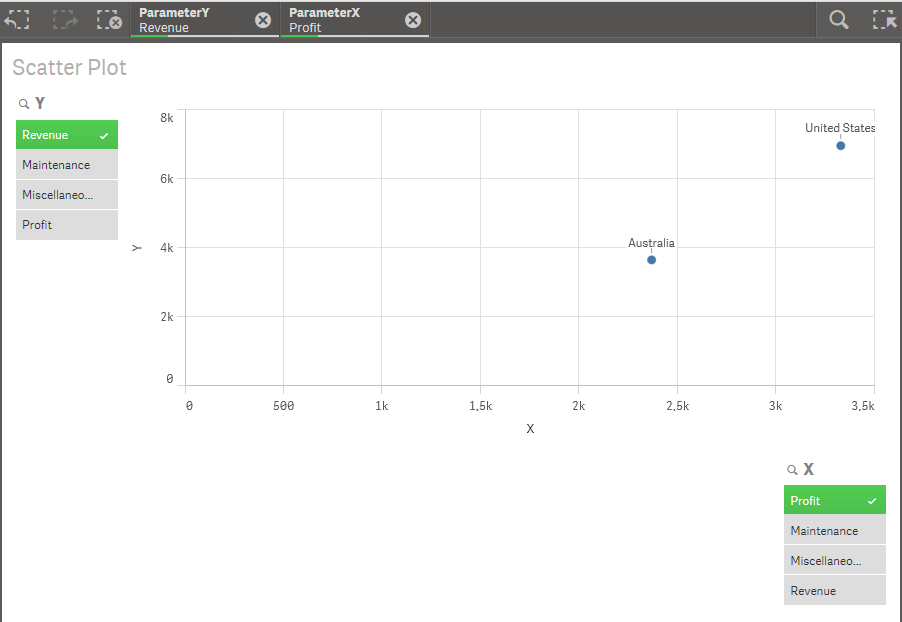
Sorry ... I forgot to point out that this could also be achieved in Qlik Sense. In Qlik Sense you would have to create two Data Islands since you don't have Alternate Stats to achieve the same thing ... that is having two extra tables with different names and field names containing the X and Y parameters... I could get back to you with an example app for Qlik Sense if you are interested.
- Mark as New
- Bookmark
- Subscribe
- Mute
- Subscribe to RSS Feed
- Permalink
- Report Inappropriate Content
Very interested in the Qlik Sense example. This will make it easier to understand the procedure.
- Mark as New
- Bookmark
- Subscribe
- Mute
- Subscribe to RSS Feed
- Permalink
- Report Inappropriate Content
Here is the Qlik Sense example but without the semi-dynamic dimension only the dynamic parameters... I will need to think a bit more to possibly come up with the semi-dynamic dimension in Qlik Sense....
But anyways ... here is an updated Qlik Sense example:
- « Previous Replies
-
- 1
- 2
- Next Replies »