Unlock a world of possibilities! Login now and discover the exclusive benefits awaiting you.
- Qlik Community
- :
- All Forums
- :
- QlikView App Dev
- :
- Re: trendline on stacked chart
- Subscribe to RSS Feed
- Mark Topic as New
- Mark Topic as Read
- Float this Topic for Current User
- Bookmark
- Subscribe
- Mute
- Printer Friendly Page
- Mark as New
- Bookmark
- Subscribe
- Mute
- Subscribe to RSS Feed
- Permalink
- Report Inappropriate Content
trendline on stacked chart
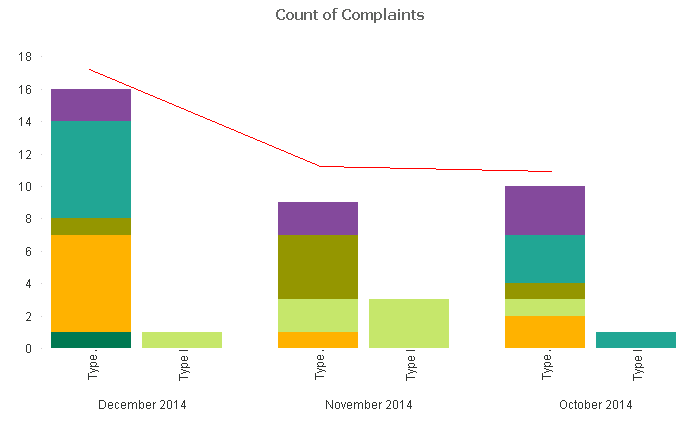
I'm new to Qlikview and I'm wondering if there is a way to accomplish the following. I'd like to add a single trendline (red) to the below mockup where the trendline represents the sum of each data set for the month. For example, in December the first 'Type' column has a value of 16 and the second column is 1,. The trendline value should be 17. I think this may not even be a trendlne but rather a dual chart (bar and line), but I'm not sure how to accomplish. As previouly stated, I'm extremely new at Qlikview, so forgive my ignorance. Thanks.
- « Previous Replies
-
- 1
- 2
- Next Replies »
Accepted Solutions
- Mark as New
- Bookmark
- Subscribe
- Mute
- Subscribe to RSS Feed
- Permalink
- Report Inappropriate Content
Hi Brent,
Please check the attached file.
Let me know when something is unclear after checking the file.
Best regards,
Ronny
PS: There are some limitations using a Product LOB listbox due to new expressions. Please check if this solution fits for you.
- Mark as New
- Bookmark
- Subscribe
- Mute
- Subscribe to RSS Feed
- Permalink
- Report Inappropriate Content
Yes it is posible.
You define a new expression, as sum of both, and in the label expression, clik on Line option and leave clik on bar option
- Mark as New
- Bookmark
- Subscribe
- Mute
- Subscribe to RSS Feed
- Permalink
- Report Inappropriate Content
Thank you for the response. I'm not sure I can do that. The Types are there from adding them as a dimension. Technically they are the same data set, just split out. Currently there is a single expression - Count(ID) for the whole chart. Should I maybe set the Types up differently - as two different data sets (maybe need some conditions for each to pull the correct data)?
- Mark as New
- Bookmark
- Subscribe
- Mute
- Subscribe to RSS Feed
- Permalink
- Report Inappropriate Content
Can you upload file qv to see?
- Mark as New
- Bookmark
- Subscribe
- Mute
- Subscribe to RSS Feed
- Permalink
- Report Inappropriate Content
Here is the document.
- Mark as New
- Bookmark
- Subscribe
- Mute
- Subscribe to RSS Feed
- Permalink
- Report Inappropriate Content
Does anyone have any ideas on this? Thank you in advance.
- Mark as New
- Bookmark
- Subscribe
- Mute
- Subscribe to RSS Feed
- Permalink
- Report Inappropriate Content
Hi,
please see this hint...
- Mark as New
- Bookmark
- Subscribe
- Mute
- Subscribe to RSS Feed
- Permalink
- Report Inappropriate Content
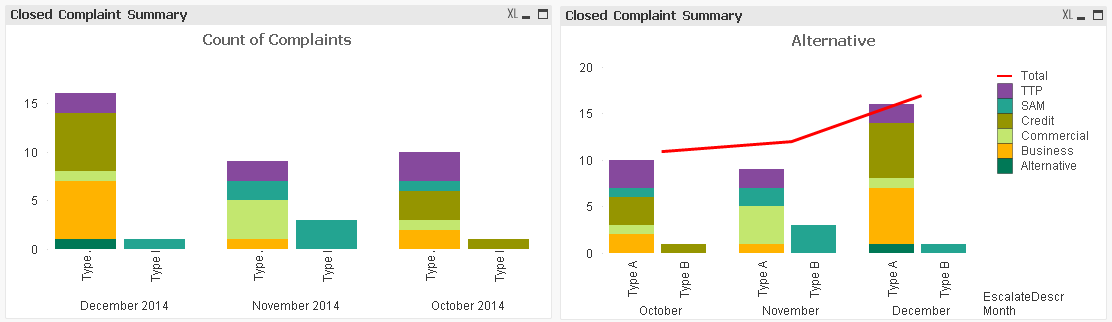
Thank you for the response, Andre. That's close. I modified the formula to read, which gives me the exact line I'm looking for:
sum(TOTAL <ComplaintDate> EscalatedInd)
But, when I switch the chart type to bar/line, the stacked bars go away - it shows only one color for the bar chart. If you have any suggestions on how to preserve the color differentiation on the bar chart that would be great. I'll keep playing with it on my end too.
- Mark as New
- Bookmark
- Subscribe
- Mute
- Subscribe to RSS Feed
- Permalink
- Report Inappropriate Content
Hi Brent,
Please check the attached file.
Let me know when something is unclear after checking the file.
Best regards,
Ronny
PS: There are some limitations using a Product LOB listbox due to new expressions. Please check if this solution fits for you.
- Mark as New
- Bookmark
- Subscribe
- Mute
- Subscribe to RSS Feed
- Permalink
- Report Inappropriate Content
Thank you Ronny. That looks like it's pretty close to what Iwas looking for. Unfortunately I'm still using the personal edition so I can't open the file. At some point soon I should be able to obtain a license and I will be able to see how you did it. Thanks for the solution!
- « Previous Replies
-
- 1
- 2
- Next Replies »