Unlock a world of possibilities! Login now and discover the exclusive benefits awaiting you.
- Qlik Community
- :
- Discover
- :
- Programs
- :
- Education
- :
- Qlik Education Discussions
- :
- Any way I can set up a Filter pane on Measures, no...
- Subscribe to RSS Feed
- Mark Topic as New
- Mark Topic as Read
- Float this Topic for Current User
- Bookmark
- Subscribe
- Mute
- Printer Friendly Page
- Mark as New
- Bookmark
- Subscribe
- Mute
- Subscribe to RSS Feed
- Permalink
- Report Inappropriate Content
Any way I can set up a Filter pane on Measures, not Dimensions?
I would like to have the option to chose what measures to show as well as what dimensions to show.
Here is a picture of what I have in mind:
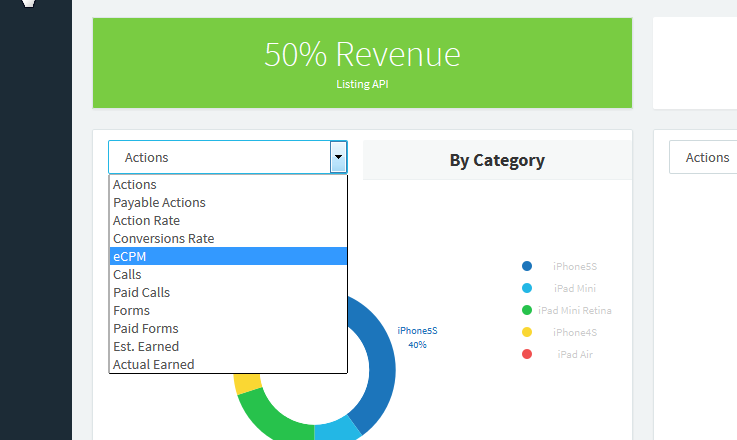
I'm thinking to have a preset chart by device, for example, and then chose what measures to show from a drop down box.
Is that possible?
Thank you,
Teddy
- Mark as New
- Bookmark
- Subscribe
- Mute
- Subscribe to RSS Feed
- Permalink
- Report Inappropriate Content
Hi Teddy,
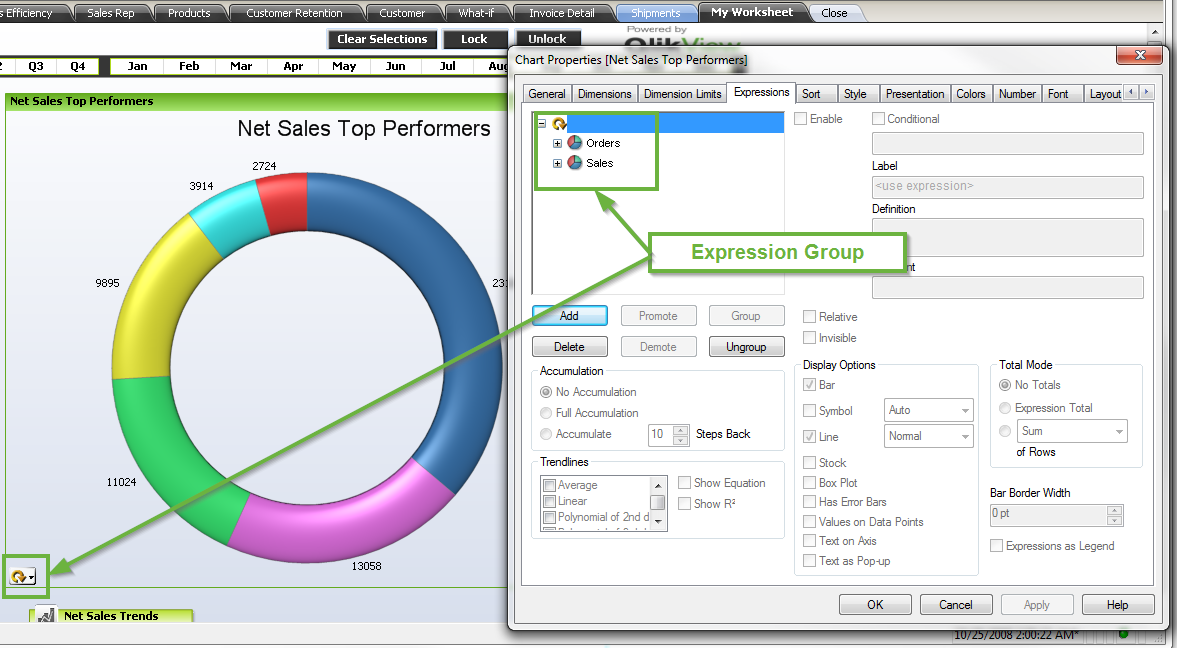
There are a couple ways to accomplish this. The simplest is with Expression Groups. You can group several expressions together and a new control will appear in the chart that will let you select which expression you wish to see, thus:
- Mark as New
- Bookmark
- Subscribe
- Mute
- Subscribe to RSS Feed
- Permalink
- Report Inappropriate Content
Another way to do what you want is to use a combination of an island table (a stand alone table that isn't connected to the rest of the data model) and variables in your expression that refer to the selected measure. For example, you could do the following:
- Create a table that contains one field that has the measures you'd like users to select. Something like this:
Load * Inline [
Measures
Sales
Forecast
Cost
Margin
]; - Add a new list box to your app that contains the field 'Measures' (check 'always one selected value'). This list box will allow the user to select which measure they'd like to see in the chart.
- Create a variable. Let's call it, vMeasure. The variable vMeasure will contain the formula:
=GetFieldSelections(Measures).
What this does is place the value from the Measures field into the variable - Finally, modify your chart expression to contain the formula:
Sum($vMeasure)
Now the user will be able to select which measure they'd like to see in the chart. Easy peasy.