Unlock a world of possibilities! Login now and discover the exclusive benefits awaiting you.
- Qlik Community
- :
- All Forums
- :
- QlikView App Dev
- :
- Re: mouseover label
- Subscribe to RSS Feed
- Mark Topic as New
- Mark Topic as Read
- Float this Topic for Current User
- Bookmark
- Subscribe
- Mute
- Printer Friendly Page
- Mark as New
- Bookmark
- Subscribe
- Mute
- Subscribe to RSS Feed
- Permalink
- Report Inappropriate Content
mouseover label
Hello,
Is it possible to change my mouseover information?
Eg if i set my mouse over a bar in a barchart it will show me the whole expression and value. Is it possible to change this so i can make my own text or reduce to only show the value?
Kind regards
Accepted Solutions
- Mark as New
- Bookmark
- Subscribe
- Mute
- Subscribe to RSS Feed
- Permalink
- Report Inappropriate Content
Hi
Short answer is Yes, this is possible, but the solution is a little convoluted.
1. In the presentations tab of your chart, switch off Pop-up Labels
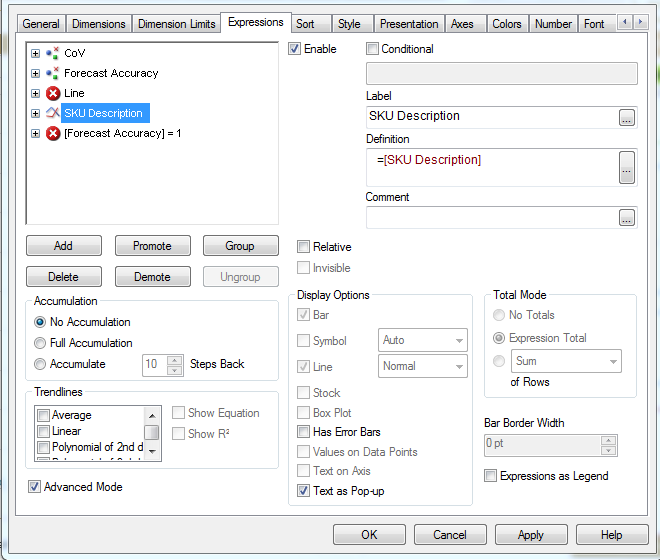
2. In the expressions tab of your chart, make sure that Text as Pop-up is un-checked
3. Add in a new expression, this one should have Text as Pop-up switched on but it should also have Bar/Symbol/Line un-checked so it doesn't appear as a new bar on the chart. You can basically put anything you like in here but just as an example, this is what I might do if I have a dimension called Region and 3 expressions called Sales/Cost/Profit:
='-----------------------------------------------------------' & chr(10) &
'Region = ' & [Region] & chr(10) &
'Sales Value = ' & [Sales] & chr(10) &
'Cost Value = ' & [Cost] & chr(10) &
'Profit = ' & [Profit] & chr(10) &
'-------------------------------------------------------------'
Obviously in the above example I'm using column names rather than actual expressions, but there's no reason why you can't just use expressions in here, including expressions that are not included in the chart at all (in the above example you might also want to include Profit as % of Sales).
This gives you a nice little pop-up that the user can read very easily.
Cheers,
Nigel.
- Mark as New
- Bookmark
- Subscribe
- Mute
- Subscribe to RSS Feed
- Permalink
- Report Inappropriate Content
Hi
Short answer is Yes, this is possible, but the solution is a little convoluted.
1. In the presentations tab of your chart, switch off Pop-up Labels
2. In the expressions tab of your chart, make sure that Text as Pop-up is un-checked
3. Add in a new expression, this one should have Text as Pop-up switched on but it should also have Bar/Symbol/Line un-checked so it doesn't appear as a new bar on the chart. You can basically put anything you like in here but just as an example, this is what I might do if I have a dimension called Region and 3 expressions called Sales/Cost/Profit:
='-----------------------------------------------------------' & chr(10) &
'Region = ' & [Region] & chr(10) &
'Sales Value = ' & [Sales] & chr(10) &
'Cost Value = ' & [Cost] & chr(10) &
'Profit = ' & [Profit] & chr(10) &
'-------------------------------------------------------------'
Obviously in the above example I'm using column names rather than actual expressions, but there's no reason why you can't just use expressions in here, including expressions that are not included in the chart at all (in the above example you might also want to include Profit as % of Sales).
This gives you a nice little pop-up that the user can read very easily.
Cheers,
Nigel.
- Mark as New
- Bookmark
- Subscribe
- Mute
- Subscribe to RSS Feed
- Permalink
- Report Inappropriate Content
Thanks for the info Nigel,
a little Addition:
I had a little "problem", when I selected a dimension value, in this case "Region". Other expression were hidden (f.e. bars), but the dimension values were still displayed.
I added the following and it worked:
=
If(IsNull(Region), Null(),
'-----------------------------------------------------------' & chr(10) &
'Region = ' & [Region] & chr(10) &
'Sales Value = ' & [Sales] & chr(10) &
'Cost Value = ' & [Cost] & chr(10) &
'Profit = ' & [Profit] & chr(10) &
'-------------------------------------------------------------'
)
Kind regards,
Marc
- Mark as New
- Bookmark
- Subscribe
- Mute
- Subscribe to RSS Feed
- Permalink
- Report Inappropriate Content
Thanks a lot for this answer. Works like a charm.
However for some reason changing the number format for this expression doesn't work. Does anyone know how the change this? I
- Mark as New
- Bookmark
- Subscribe
- Mute
- Subscribe to RSS Feed
- Permalink
- Report Inappropriate Content
Hi,
I'm trying to apply this same concept to a scatter chart. It works, however I can't untick 'bar' or 'line' for my new 'Text as pop-up' expression type, so it changes the look of my two visible expressions.
Ideas on what may be causing this?
Thanks for your help.
M
- Mark as New
- Bookmark
- Subscribe
- Mute
- Subscribe to RSS Feed
- Permalink
- Report Inappropriate Content
May i know how is it possible in QlikSense??
- Mark as New
- Bookmark
- Subscribe
- Mute
- Subscribe to RSS Feed
- Permalink
- Report Inappropriate Content
Works well but if you have more than one bar chart how do you handle it then?
- Mark as New
- Bookmark
- Subscribe
- Mute
- Subscribe to RSS Feed
- Permalink
- Report Inappropriate Content
Can Anyone give me the same solution for line chart. I can see the custom text as popup in bar chart but not in line chart. I am trying to convert the same chart from bar to line