Unlock a world of possibilities! Login now and discover the exclusive benefits awaiting you.
- Qlik Community
- :
- All Forums
- :
- QlikView App Dev
- :
- Re: Dynamic line chart background colours
- Subscribe to RSS Feed
- Mark Topic as New
- Mark Topic as Read
- Float this Topic for Current User
- Bookmark
- Subscribe
- Mute
- Printer Friendly Page
- Mark as New
- Bookmark
- Subscribe
- Mute
- Subscribe to RSS Feed
- Permalink
- Report Inappropriate Content
Dynamic line chart background colours
Hi gurus,
I have a line chart of historic data, volume plotted against 'Historic Week Start Date'. I want my line colour to change based on historic Fiscal Year.
I have currently achieved this by hard coding in the following in the Background Colour section of my expression:
=if(HistoricalFiscalYear='FY11',rgb(70,137,164),
if(HistoricalFiscalYear='FY12',rgb(171,167,17),
if(HistoricalFiscalYear='FY13',rgb(141,25,8),
if(HistoricalFiscalYear='FY14',rgb(236,129,0),
if(HistoricalFiscalYear='FY15',rgb(114,85,37))))))
This achieves the intended result:
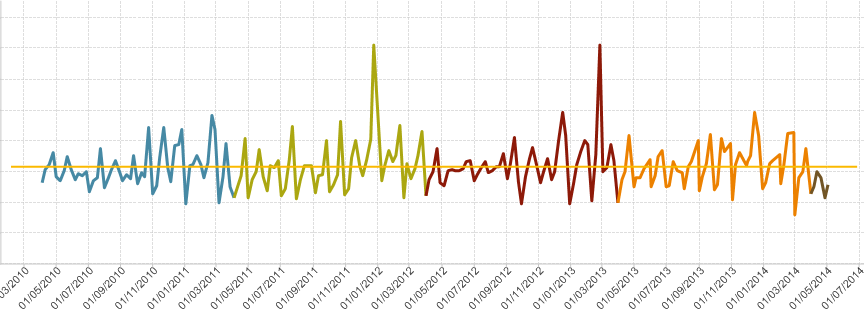
However, to account for the possibility of the data being loaded in for more / different fiscal years, I would like to make this expression dynamic.
I have another field, 'HistoricalFYRow' which is a row count, which could potentially be used in the expression (as was finding it difficult to do max / min on the fiscal year field (FY11, FY12...).
Suggestions of how to modify this formula, perhaps with a variable?
Thanks!
Mel
Accepted Solutions
- Mark as New
- Bookmark
- Subscribe
- Mute
- Subscribe to RSS Feed
- Permalink
- Report Inappropriate Content
Try =color(FieldIndex('HistoricalFiscalYear',HistoricalFiscalYear)).
Or read this blog for other options: Colors in charts
talk is cheap, supply exceeds demand
- Mark as New
- Bookmark
- Subscribe
- Mute
- Subscribe to RSS Feed
- Permalink
- Report Inappropriate Content
Try =color(FieldIndex('HistoricalFiscalYear',HistoricalFiscalYear)).
Or read this blog for other options: Colors in charts
talk is cheap, supply exceeds demand
- Mark as New
- Bookmark
- Subscribe
- Mute
- Subscribe to RSS Feed
- Permalink
- Report Inappropriate Content
Brilliant, thanks!