Unlock a world of possibilities! Login now and discover the exclusive benefits awaiting you.
- Qlik Community
- :
- Forums
- :
- Analytics
- :
- New to Qlik Analytics
- :
- Re: How to do a histogram?
- Subscribe to RSS Feed
- Mark Topic as New
- Mark Topic as Read
- Float this Topic for Current User
- Bookmark
- Subscribe
- Mute
- Printer Friendly Page
- Mark as New
- Bookmark
- Subscribe
- Mute
- Subscribe to RSS Feed
- Permalink
- Report Inappropriate Content
How to do a histogram?
Hi everyone!
I am not used to use QlikVio. Actually, this techonolgy is new for me, but in the future I will use it more often. Could you give some help?
I am lost in the midle of so much information and I am still trying to figure out how to work with this program. Can you give me the steps how to do a simple histogram?
I have a Data with numbers from 0 to 20. I want to do a histogram which counts how many numbers are in specifics times periods, such as:
]0,1[
]1,2[
]2,3[
]3,6[
]6,10[
]10,20[. How can I do it? I tried to calculate an dimension using if and then do a count for the data but it doesnt work.
I will grateful if some one could help me out.
Thanks in advance,
Best,
Pedro Pereira
- Mark as New
- Bookmark
- Subscribe
- Mute
- Subscribe to RSS Feed
- Permalink
- Report Inappropriate Content
A complete description can be found in this Article: Recipe for a Histogram
HIC
@ sasi kumar:
It would be better if you link to the original article instead of copying someone else's work and using it as your own answer.
- Mark as New
- Bookmark
- Subscribe
- Mute
- Subscribe to RSS Feed
- Permalink
- Report Inappropriate Content
@Henric:
Sure. It was a coincidence which i referred your article last week. Hence pasted the content which helped me. Sorry if that hurt you.
- Mark as New
- Bookmark
- Subscribe
- Mute
- Subscribe to RSS Feed
- Permalink
- Report Inappropriate Content
I have the Qlikview and I can't open the qvf file which you sent 
- Mark as New
- Bookmark
- Subscribe
- Mute
- Subscribe to RSS Feed
- Permalink
- Report Inappropriate Content
It isn't working the way you say.
And do you know how to setup a histogram in chart bar without creating a script for it?
Thanks anyway for the information, even though I can't put it together to work out.
- Mark as New
- Bookmark
- Subscribe
- Mute
- Subscribe to RSS Feed
- Permalink
- Report Inappropriate Content
What I wanted was buckets.
Do you know how can I sort my graph in ascending? I already try every option from the sort window.
Thanks for the help. Here is my code and my output.
This is the code on calculated dimension:
= If(Diferença<=1 ,'0-1',
If(Diferença>1 and Diferença <=2,'1-2',
If(Diferença>2 and Diferença <=3,'2-3',
If(Diferença>3 and Diferença <=4,'3-4',
If(Diferença>4 and Diferença <=5,'4-5',
If(Diferença>5 and Diferença <=6,'5-6',
If(Diferença>6 and Diferença <=7,'6-7',
If(Diferença>7 and Diferença <=8,'7-8',
If(Diferença>8 and Diferença <=9,'8-9',
If(Diferença>9 and Diferença <=10,'9-10',
If(Diferença>10,'>10',
)))))))))))
And my output is like that:
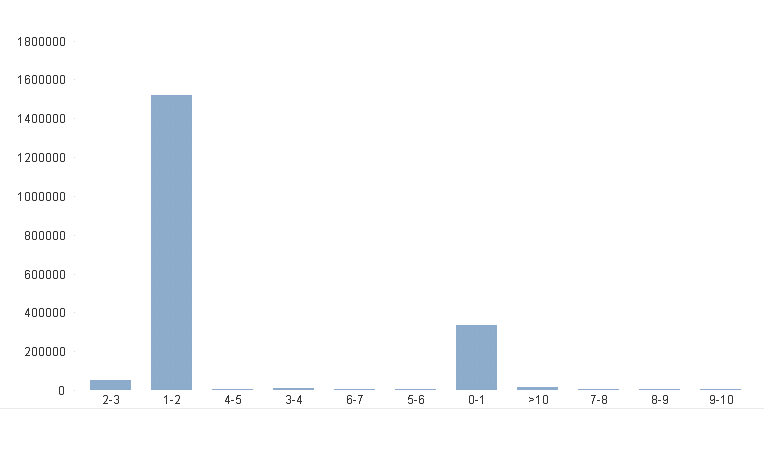
How can I sorted this by the order I put on the code?
- Mark as New
- Bookmark
- Subscribe
- Mute
- Subscribe to RSS Feed
- Permalink
- Report Inappropriate Content
The odd bin of '>10' doesn't allow for easy sorting so you have to get creative with 'Dual', then sort numerically;
=
If(Diferença<=1 ,Dual('0-1',0),
If(Diferença>1 and Diferença <=2,Dual('1-2',1),
If(Diferença>2 and Diferença <=3,Dual('2-3',2),
If(Diferença>3 and Diferença <=4,Dual('3-4',3),
If(Diferença>4 and Diferença <=5,Dual('4-5',4),
If(Diferença>5 and Diferença <=6,Dual('5-6',5),
If(Diferença>6 and Diferença <=7,Dual('6-7',6),
If(Diferença>7 and Diferença <=8,Dual('7-8',7),
If(Diferença>8 and Diferença <=9,Dual('8-9',8),
If(Diferença>9 and Diferença <=10,Dual('9-10',9),
If(Diferença>10,Dual('>10',10)
)))))))))))
- Mark as New
- Bookmark
- Subscribe
- Mute
- Subscribe to RSS Feed
- Permalink
- Report Inappropriate Content
Thanks you very much!
Could you tell why it wasnt working? And why e.g. 2-3 was first than 1-2?
PS. I learning how to work with Qlikview I am think if I understand deeply how Qlikview works, I'll learn faster and better.
- Mark as New
- Bookmark
- Subscribe
- Mute
- Subscribe to RSS Feed
- Permalink
- Report Inappropriate Content
Pedro, I'm not sure why yours wasn't sorting correctly the first time...I did not see your sort criteria. It's possible neither text nor numeric were checked.
The reason Dual works is it assigns a numeric value that you determine for the text value. So, since your dimension has been hard-coded it was easy enough to add the numeric value based on a known order desired. Notice the last value for each bin cycles 0 through 10. You should look up 'Dual' in the help to see a fuller explanation.
Glad it helped. BTW, this method isn't best done in the front end. I'd prefer it under the hood in the script. If you find the document being slowed down during selections you may want to look into that.
- Mark as New
- Bookmark
- Subscribe
- Mute
- Subscribe to RSS Feed
- Permalink
- Report Inappropriate Content
I used everyone I neither seems to work out.
The reason why the Dual worked I understood but thanks anyway!
If it starts to get slow I will implent on the script, thanks for the advice.
- Mark as New
- Bookmark
- Subscribe
- Mute
- Subscribe to RSS Feed
- Permalink
- Report Inappropriate Content
hi josh,
Can you please explain how to add the bell curve in qlik sense.
you explain for your above .qvf. it will be helpful.
Thanks,
Pramod