Unlock a world of possibilities! Login now and discover the exclusive benefits awaiting you.
- Qlik Community
- :
- All Forums
- :
- QlikView App Dev
- :
- Re: Help on Reference Lines
- Subscribe to RSS Feed
- Mark Topic as New
- Mark Topic as Read
- Float this Topic for Current User
- Bookmark
- Subscribe
- Mute
- Printer Friendly Page
- Mark as New
- Bookmark
- Subscribe
- Mute
- Subscribe to RSS Feed
- Permalink
- Report Inappropriate Content
Help on Reference Lines
Hi! I'm new to Qlikview and still learning the ropes. I have a bar chart with a dimension and a expression. The dimension includes only two categories on the x-axis, so two bars. I would like to add reference lines for each of the two bars. The reference line would refer to another amount that is relative to the category on the x-axis.The two reference lines will be on different levels due to the varying amounts.
Let's say the dimension is pets and the two bars are a dog and a cat. The bar represents the sum of the height of each type of pet. I would like the reference line to represent the sum of the weight of each type of pet. Terrible example, but I hope you get the point. I would appreciate your help on this. Thanks!
- Mark as New
- Bookmark
- Subscribe
- Mute
- Subscribe to RSS Feed
- Permalink
- Report Inappropriate Content
Reference line canbe added at Property>>Presentation>>Reference Line Section.
Click Add>> a dialog will appear o define your Expression and Label properties
- Mark as New
- Bookmark
- Subscribe
- Mute
- Subscribe to RSS Feed
- Permalink
- Report Inappropriate Content
Yes, I tried that, but the reference lines are not appearing. I read that you have to use the Continuous X option, but it's grayed out.
- Mark as New
- Bookmark
- Subscribe
- Mute
- Subscribe to RSS Feed
- Permalink
- Report Inappropriate Content
Your Reference line Values can be miniscule to appear in your chart, This happens if your Dimensions are in Thousands and your Reference is little value, you might find it at the bottom of the grid.
try a Straight Table Chart fast change just to verify your Reference Values
- Mark as New
- Bookmark
- Subscribe
- Mute
- Subscribe to RSS Feed
- Permalink
- Report Inappropriate Content
Try and atatched a sample file, so the community might be able to help you quicker by example
- Mark as New
- Bookmark
- Subscribe
- Mute
- Subscribe to RSS Feed
- Permalink
- Report Inappropriate Content
Thanks for the help Johnathan. The info on my file is bit confidential, but I can provide a sample file if necessary.
The reference line amounts are nearly equivalent to the bar values. They are in the tens of millions and are 1-2 million dollars off. Any other issues that you foresee?
- Mark as New
- Bookmark
- Subscribe
- Mute
- Subscribe to RSS Feed
- Permalink
- Report Inappropriate Content
Can you try a defined single value of lets say, +1 million of the value of your first Bar/Category.
I suspect the expression logic you put in your Reference is doing the trick.
My understanding to a Reference line is it is a Straight Ref Line, therefore a single value for all Bars and not changing.
What is the result of your reference Line Values if you view in straight Table?
- Mark as New
- Bookmark
- Subscribe
- Mute
- Subscribe to RSS Feed
- Permalink
- Report Inappropriate Content
Hi Johnathan, your tips did help, But, it only creates a single straight line. I would like the bar graph to look like this 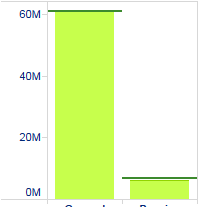
Each reference line per bar. Thanks for the help so far!
- Mark as New
- Bookmark
- Subscribe
- Mute
- Subscribe to RSS Feed
- Permalink
- Report Inappropriate Content
I suppose you can add two Ref Lines(diff colors), 1 for each Bar as a workaround to your problem.
- Mark as New
- Bookmark
- Subscribe
- Mute
- Subscribe to RSS Feed
- Permalink
- Report Inappropriate Content
Please refer the Discussion, This may help you.