Unlock a world of possibilities! Login now and discover the exclusive benefits awaiting you.
- Qlik Community
- :
- Discover
- :
- Programs
- :
- Education
- :
- Qlik Education Discussions
- :
- Re: Last 3 months data in expression for a bar cha...
- Subscribe to RSS Feed
- Mark Topic as New
- Mark Topic as Read
- Float this Topic for Current User
- Bookmark
- Subscribe
- Mute
- Printer Friendly Page
- Mark as New
- Bookmark
- Subscribe
- Mute
- Subscribe to RSS Feed
- Permalink
- Report Inappropriate Content
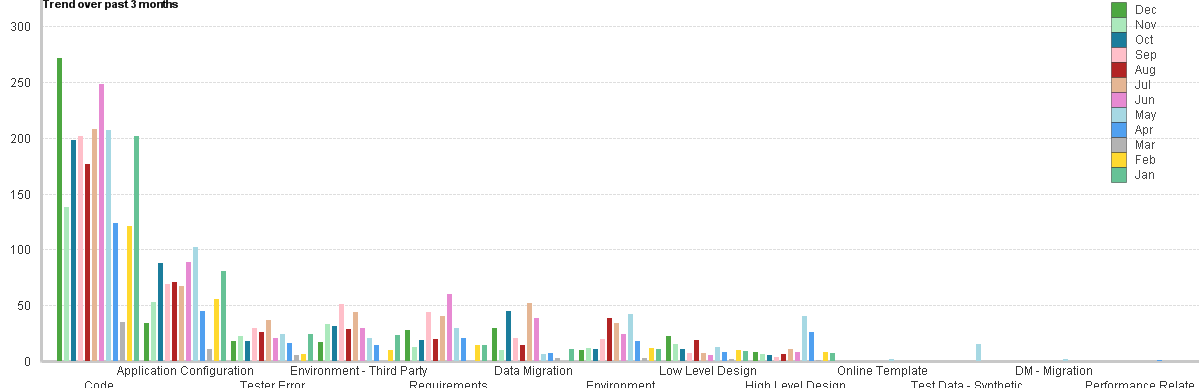
Last 3 months data in expression for a bar chart
Hi all ,
i have 12 months of data , in which i would like to use last 3 months of data while displaying in bar chart.
for suppose i have feb 2014 to jan 2015 data , my last 3 months data should be jan 2015, dec 2014, Nov 2014
my dimensions are
terc_defect
monthterc
i need an expression to take last 3 months data
Thanks in advance
- Mark as New
- Bookmark
- Subscribe
- Mute
- Subscribe to RSS Feed
- Permalink
- Report Inappropriate Content
yes i want to count the category ,yes i do have many files and it is a large data set
when i am using your formula . i am getting all months in the data set
- Mark as New
- Bookmark
- Subscribe
- Mute
- Subscribe to RSS Feed
- Permalink
- Report Inappropriate Content
This formula was for data set I have posted not for yours
- Mark as New
- Bookmark
- Subscribe
- Mute
- Subscribe to RSS Feed
- Permalink
- Report Inappropriate Content
oh ok , but can you tell me what monthstart(max(monterc),-3 function gives ?
and also what would be desired expression for my data , do you need any more input robert?
- Mark as New
- Bookmark
- Subscribe
- Mute
- Subscribe to RSS Feed
- Permalink
- Report Inappropriate Content
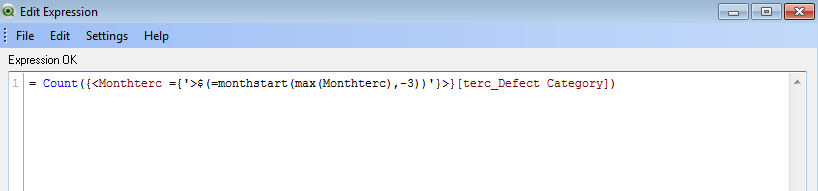
Try
Script:
Directory;
LOAD Date(terc) as monthterc,
[Defect Category]
FROM....
Expression:
count({<monthterc={'>$(=monthstart(max(monthterc),-2))'}>}[Defect Category])
- Mark as New
- Bookmark
- Subscribe
- Mute
- Subscribe to RSS Feed
- Permalink
- Report Inappropriate Content
hey thanx robert it is working  , but now what if i have to calculate average on x axis
my expression is average = sum(defect category)/count(defect category)
how do i use set analysis in this context .
- Mark as New
- Bookmark
- Subscribe
- Mute
- Subscribe to RSS Feed
- Permalink
- Report Inappropriate Content
Can you say what are you trying to achieve?
You have only Text value so first there is no Sum of any kind and then if you need average with Set Analysis we need a condition.
- Mark as New
- Bookmark
- Subscribe
- Mute
- Subscribe to RSS Feed
- Permalink
- Report Inappropriate Content
Hi Robert,
| days_open | Enterprise system |
| 19 | Singleview |
| 6 | Portal |
| 49 | Android App |
| 69 | Migration Activity |
| 158 | Migration Activity |
| 69 | Migration Activity |
| 61 | Appsuite |
| 132 | Appsuite |
| 46 | Migration Activity |
| 56 | Migration Activity |
| 32 | Appsuite |
| 48 | Migration Activity |
| 151 | Appsuite |
| 73 | Appsuite |
| 69 | Migration Activity |
| 55 | Migration Activity |
| 69 | Migration Activity |
| 77 | Migration Activity |
| 55 | Migration Activity |
| 59 | Appsuite |
| 55 | Migration Activity |
| 48 | Migration Activity |
| 131 | Migration Activity |
| 185 | Mail Client |
| 55 | Migration Activity |
| 69 | Migration Activity |
| 59 | Mail Client |
| 74 | Migration Activity |
now my expression is average = sum(daysopen)/count(enterprise system)
dimensions are enteprise system and monthterc
now i have to limit months using set analysis ?
let me know if you need any more output?
Thanks in advance
- Mark as New
- Bookmark
- Subscribe
- Mute
- Subscribe to RSS Feed
- Permalink
- Report Inappropriate Content
I would rather have the full set of data(all 3 columns) or a Excel spreadsheet...
If you can please attached.
- Mark as New
- Bookmark
- Subscribe
- Mute
- Subscribe to RSS Feed
- Permalink
- Report Inappropriate Content
| days_open | Enterprise system | Montterc |
| 19 | Singleview | 11/11/2014 0:00 |
| 6 | Portal | 11/11/2014 0:00 |
| 49 | Android App | 11/14/2014 0:00 |
| 69 | Migration Activity | 11/14/2014 0:00 |
| 158 | Migration Activity | 11/27/2014 0:00 |
| 69 | Migration Activity | 11/27/2014 0:00 |
| 61 | Appsuite | 11/26/2014 0:00 |
| 132 | Appsuite | 11/27/2014 0:00 |
| 46 | Migration Activity | 11/11/2014 0:00 |
| 56 | Migration Activity | 11/20/2014 0:00 |
| 32 | Appsuite | 11/6/2014 0:00 |
| 48 | Migration Activity | 11/12/2014 0:00 |
| 151 | Appsuite | 11/11/2014 0:00 |
| 73 | Appsuite | 11/27/2014 0:00 |
| 69 | Migration Activity | 11/27/2014 0:00 |
| 55 | Migration Activity | 11/14/2014 0:00 |
| 69 | Migration Activity | 11/26/2014 0:00 |
| 77 | Migration Activity | 11/3/2014 0:00 |
| 55 | Migration Activity | 11/13/2014 0:00 |
| 59 | Appsuite | 11/3/2014 0:00 |
| 55 | Migration Activity | 11/3/2014 0:00 |
| 48 | Migration Activity | 11/3/2014 0:00 |
| 131 | Migration Activity | 11/4/2014 0:00 |
| 185 | Mail Client | 11/3/2014 0:00 |
| 55 | Migration Activity | 11/24/2014 0:00 |
| 69 | Migration Activity | 11/19/2014 0:00 |
| 59 | Mail Client | 11/19/2014 0:00 |
| 74 | Migration Activity | 11/3/2014 0:00 |
hope it helps
- Mark as New
- Bookmark
- Subscribe
- Mute
- Subscribe to RSS Feed
- Permalink
- Report Inappropriate Content
=avg({<Montterc={'>$(=monthStart(max(Montterc),-2))'} ,[Enterprise system]= >}days_open)
Script:
LOAD days_open,
[Enterprise system],
date(Montterc) as Montterc
FROM
[151270.xlsx]
(ooxml, embedded labels, table is tab1);