Unlock a world of possibilities! Login now and discover the exclusive benefits awaiting you.
- Qlik Community
- :
- All Forums
- :
- QlikView App Dev
- :
- Re: Fast Type Change using Different Dimensions
- Subscribe to RSS Feed
- Mark Topic as New
- Mark Topic as Read
- Float this Topic for Current User
- Bookmark
- Subscribe
- Mute
- Printer Friendly Page
- Mark as New
- Bookmark
- Subscribe
- Mute
- Subscribe to RSS Feed
- Permalink
- Report Inappropriate Content
Fast Type Change using Different Dimensions
I am looking at ways for sales staff to visualise data in several ways. I would like to make it easy to use on a mobile device, such as a tablet. The data is straight-forward records of sales which several metrics such as sales area, month, year, purchaserID etc.
I have used a cyclic as a dimension to allow the selection on the chart and this works (quite) well for a single chart type.
Fast type change seems like a nice idea too, but I am wondering if it is possible to control the dimensions used for each chart type. Ideally this would be in the properties - for example, using conditional selection of dimensions. This would be useful if switching from a bar chart to a straight table (where its easier to list alot of data).
Any ideas or advice on these types of display would be useful.
- Mark as New
- Bookmark
- Subscribe
- Mute
- Subscribe to RSS Feed
- Permalink
- Report Inappropriate Content
No, the fast type change can't be used to replace dimensions too. What you can try instead is create separate chart objects and show/hide them as needed. You can use the conditional display option on the Layout tab for this, for example with an expression that checks the value of a variable or a selected value in a list box.
talk is cheap, supply exceeds demand
- Mark as New
- Bookmark
- Subscribe
- Mute
- Subscribe to RSS Feed
- Permalink
- Report Inappropriate Content
Hi Rechard,
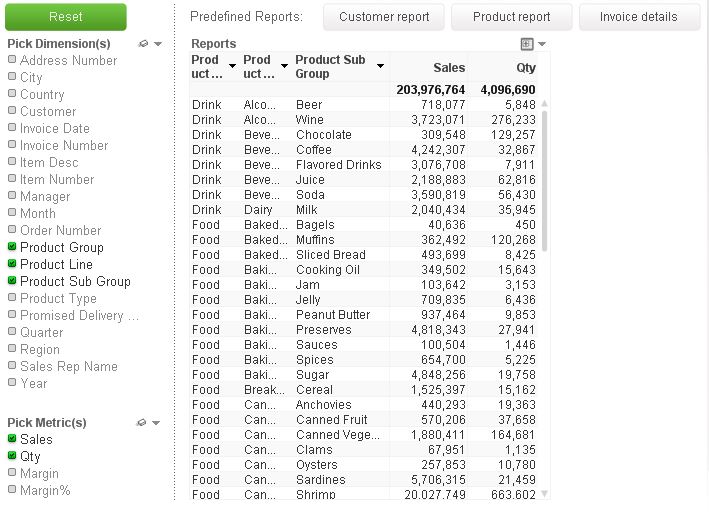
You can do as suggested by Gysbert or there is one more option explained in Qlikview example documents(comes with Qlikview desktop download). You can check 'Whats new in Qlikview 11' qvw and go to the 'Reports' tab. There is a good way of creating dynamic reports based on user selected dimensions and expressions. I have attached a snapshot of it.
Hope this helps,
Anosh