Unlock a world of possibilities! Login now and discover the exclusive benefits awaiting you.
- Qlik Community
- :
- Forums
- :
- Analytics
- :
- New to Qlik Analytics
- :
- Re: Price Difference Table chart in Qlik Sense
- Subscribe to RSS Feed
- Mark Topic as New
- Mark Topic as Read
- Float this Topic for Current User
- Bookmark
- Subscribe
- Mute
- Printer Friendly Page
- Mark as New
- Bookmark
- Subscribe
- Mute
- Subscribe to RSS Feed
- Permalink
- Report Inappropriate Content
Price Difference Table chart in Qlik Sense
Dear Community
I wonder how can I build a Price Difference Table in Qlik Sense. It is to show the Percentage price variance between Current price and Last price for parts.
Calculation : [ ( Current price - Last price ) / Last PO price x 100% ]
| Part No. | Price | Date | Price Difference |
| ABC1234 | 1000 | 1/1/2015 | - |
| ABC1234 | 1500 | 1/2/2015 | 50% |
| ABC3456 | 1500 | 3/1/2015 | - |
| ABC3456 | 1320 | 4/2/2015 | -12% |
| BCD3455 | 3000 | 16/1/2015 | - |
| BCD3455 | 3000 | 15/2/2015 | 0% |
| ERT9999 | 2000 | 20/2/2015 | - |
| JSH7670 | 1000 | 5/1/2015 | - |
| JSH7670 | 1100 | 2/2/2015 | 10% |
| RTY8909 | 3000 | 21/1/2015 | - |
| RTY8909 | 3000.15 | 4/2/2015 | 0% |
| TYU2435 | 2350 | 13/1/12015 | - |
| TYU2435 | 2500 | 20/1/2015 | 6% |
| TYU2435 | 3000 | 15/2/2015 | 20% |
| UIO8989 | 2350 | 4/1/2015 | - |
How can I set the expression in Measures for calculating Price Difference?
Thank you very much. Please give me a helping hand.
- « Previous Replies
-
- 1
- 2
- Next Replies »
Accepted Solutions
- Mark as New
- Bookmark
- Subscribe
- Mute
- Subscribe to RSS Feed
- Permalink
- Report Inappropriate Content
OK GOT IT - this time to look like your example - see attached:
I also sorted the dates correct in the interface:
Click to enlarge image
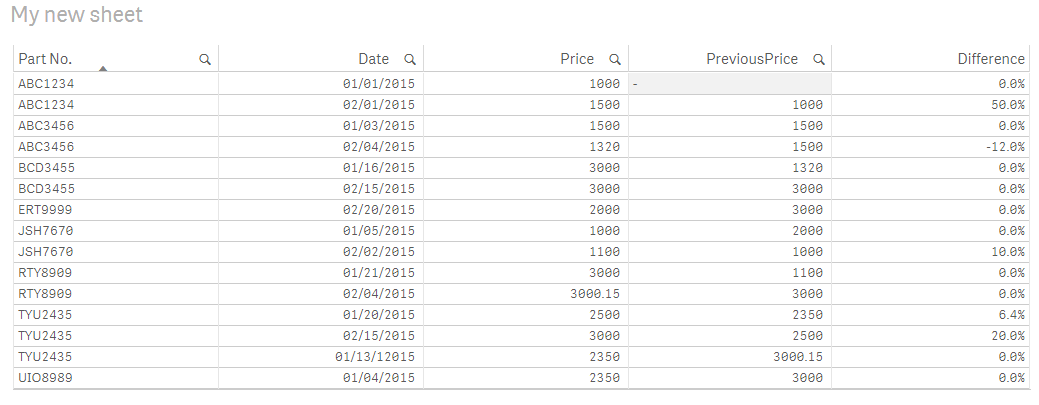
if(peek([Part No.]) = [Part No.],
(Price - peek([Price])) / peek([Price]) * 1,0) as PeekDifference
LOAD
    "Part No.",
    Date(Date#([Date],'DD/MM/YYYY'),'MM/DD/YYYY') as "Date",
    previous([Price]) as PreviousPrice,
    Price,

  if(peek([Part No.]) = [Part No.],
  (Price - peek([Price])) / peek([Price]) * 1,0) as PeekDifference

FROM [lib://715333]
(html, codepage is 1252, embedded labels, table is @2);
Please mark the appropriate replies as helpful / correct so our team and other members know that your question(s) has been answered to your satisfaction.
Regards,
Mike Tarallo
Qlik
Mike Tarallo
Qlik
- Mark as New
- Bookmark
- Subscribe
- Mute
- Subscribe to RSS Feed
- Permalink
- Report Inappropriate Content
Hello Tang man,
In the Master Items panel - you can create a new measure as such:
You would calculate quite simply such as:
sum( [Current price] - [Last price] ) / [Last PO price] x 1 - the format the result in the column.
Here is an example using sales and cost to create margin percentage:
Sum([Sales Margin Amount])/Sum([Sales Amount])
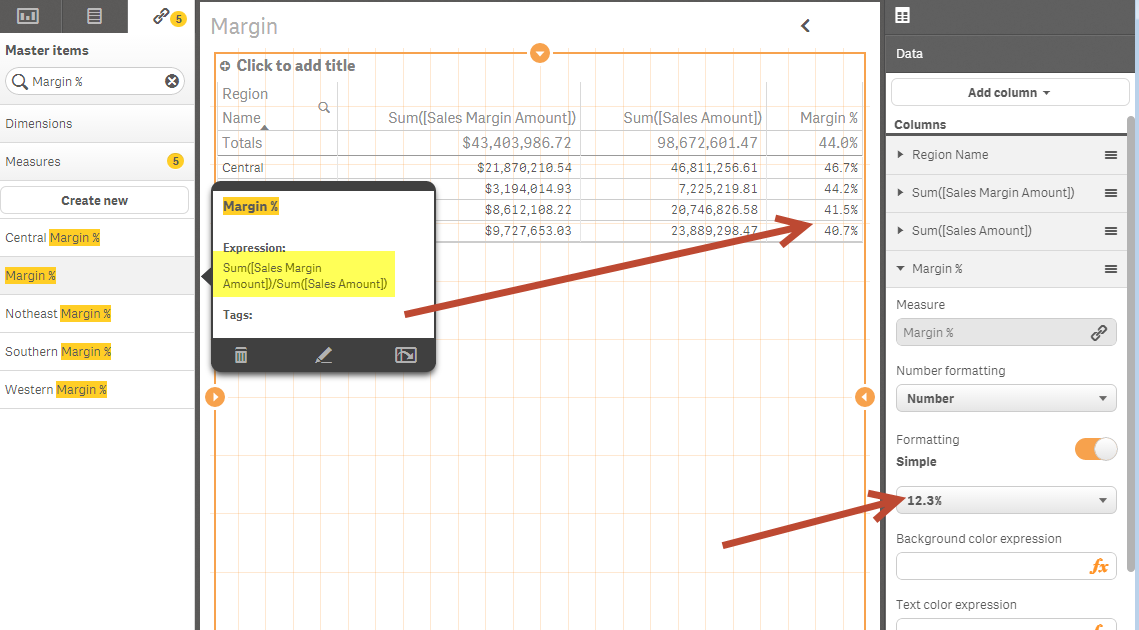
I also attached the sample App - the last sheet named Margin has this example:
Please check out this video as well: Using The Master Library (video)
Please mark the appropriate replies as correct / helpful so our team and other members know that your question(s) has been answered to your satisfaction.
Regards,
Mike Tarallo
Qlik
Mike Tarallo
Qlik
- Mark as New
- Bookmark
- Subscribe
- Mute
- Subscribe to RSS Feed
- Permalink
- Report Inappropriate Content
Hello Michael Tarallo
Thank you very much for help. But I still can't build the table. As using you concept, Price Difference should be calculated by
([Price] / [Last Price]) -1 or
(sum([Price]) / sum([Last Price])) -1
| Part No. | Date | Price | Last Price | Price Difference | Remark |
| ABC1234 | 1/1/2015 | 1000 | - | - | Null Value |
| ABC1234 | 1/2/2015 | 1500 | 1000 | 50% | |
| ABC3456 | 3/1/2015 | 1500 | - | - | Null Value |
| ABC3456 | 4/2/2015 | 1320 | 1500 | -12% | |
| BCD3455 | 16/1/2015 | 3000 | - | - | Null Value |
| BCD3455 | 15/2/2015 | 3000 | 3000 | 0% | |
| ERT9999 | 20/2/2015 | 2000 | - | - | Null Value (new part in Feb) |
| JSH7670 | 5/1/2015 | 1000 | - | - | Null Value |
| JSH7670 | 2/2/2015 | 1100 | 1000 | 10% | |
| RTY8909 | 21/1/2015 | 3000 | - | - | Null Value |
| RTY8909 | 4/2/2015 | 3000.15 | 3000 | 0% | |
| TYU2435 | 13/1/12015 | 2350 | - | - | Null Value |
| TYU2435 | 20/1/2015 | 2500 | 2350 | 6% | Different Last Price at different moment. |
| TYU2435 | 15/2/2015 | 3000 | 2500 | 20% | Different Last Price at different moment. |
| UIO8989 | 4/1/2015 | 2350 | - | - | Null Value (no next value) |
However, I have some problems.
1. I don't know how to extract the Last Price for every part.
a. If I using something like max(Date), it only returns one maximum date (20/2/2015) for the parts (ERT9999, TYU2435), not every part's maximum date (Last date).
b. Besides, in the case, the last price for Part No. TYU2435 at 20/1/2015 is 2350 and at 15/2/2015 is 2500. How can I find the right last price at the particular moment?
2. I don't know how to change the data to be Null value when comparing the same date value.
If there is comparing the same date value, it should be null value ( - ) to prevent misleading. How can I make it? It there using If statement or Null() function? As Min(Date) is not workable too.
I got much problems in the table chart. Please help me and thank you very much for answering.
- Mark as New
- Bookmark
- Subscribe
- Mute
- Subscribe to RSS Feed
- Permalink
- Report Inappropriate Content
Ah - ok - form what I see - your "last price" is calculated from the "price field" and the date field - in other words you do not have an actual field names LAST PRICE - correct?
let me take a look and I will attempted to build you a sample based on this.
Mike
Mike Tarallo
Qlik
- Mark as New
- Bookmark
- Subscribe
- Mute
- Subscribe to RSS Feed
- Permalink
- Report Inappropriate Content
Hi Tang man - check this out - attached .qvf file - copy to C:\Users\<user profile>\Documents\Qlik\Sense\Apps and refresh the Qlik Sense Desktop by pressing F5
Note: I am using the WEBFILE data connection in Qlik Sense to THIS actual discussion thread as a data source. YES -  you can do that - it will automatically decipher the tables and display them as selectable data tables.
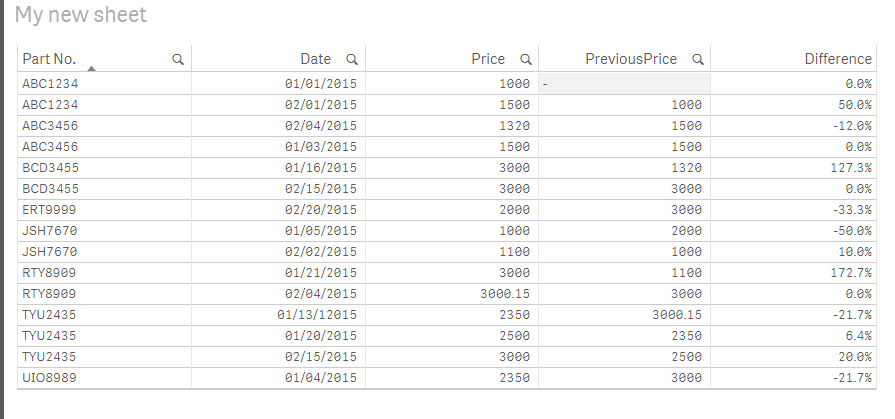
I am using the PEEK function to look at the previous row of data - that will put the new data value on the current row to perform the calculation - as in:
(Price - peek([Price])) / peek([Price]) * 1 as Difference
LOAD
    "Part No.",
    Date(Date#([Date],'DD/MM/YYYY'),'MM/DD/YYYY') as "Date",
    peek([Price]) as PreviousPrice,
    Price,
    (Price - peek([Price])) / peek([Price]) * 1 as Difference
FROM [lib://715333]
(html, codepage is 1252, embedded labels, table is @2);
Click to enlarge image:
Let us know how you do.
Please mark the appropriate replies as CORRECT / HELPFUL so our team and other members know that your question(s) has been answered to your satisfaction.
Regards,
Mike Tarallo
Qlik
Mike Tarallo
Qlik
- Mark as New
- Bookmark
- Subscribe
- Mute
- Subscribe to RSS Feed
- Permalink
- Report Inappropriate Content
I just realized the dates are not in order - so the values may not be correct - it just so happens that value for the dates were the same, so when matching against your example it appeared correct - let me take another look.
Mike
Mike Tarallo
Qlik
- Mark as New
- Bookmark
- Subscribe
- Mute
- Subscribe to RSS Feed
- Permalink
- Report Inappropriate Content
OK GOT IT - this time to look like your example - see attached:
I also sorted the dates correct in the interface:
Click to enlarge image
if(peek([Part No.]) = [Part No.],
(Price - peek([Price])) / peek([Price]) * 1,0) as PeekDifference
LOAD
    "Part No.",
    Date(Date#([Date],'DD/MM/YYYY'),'MM/DD/YYYY') as "Date",
    previous([Price]) as PreviousPrice,
    Price,

  if(peek([Part No.]) = [Part No.],
  (Price - peek([Price])) / peek([Price]) * 1,0) as PeekDifference

FROM [lib://715333]
(html, codepage is 1252, embedded labels, table is @2);
Please mark the appropriate replies as helpful / correct so our team and other members know that your question(s) has been answered to your satisfaction.
Regards,
Mike Tarallo
Qlik
Mike Tarallo
Qlik
- Mark as New
- Bookmark
- Subscribe
- Mute
- Subscribe to RSS Feed
- Permalink
- Report Inappropriate Content
Hello Michael Tarallo
Thank you very very very much
 . I can build the table chart. I am so grad that you support and help me a lot
 .
.

However, there still a little problem. I wonder why the peek() function cannot be used directly in measure and it should be used in the data load editor. When we should use function directly in measure or in the data load editor? I always cannot figure it.
Thank you very much for answering.
- Mark as New
- Bookmark
- Subscribe
- Mute
- Subscribe to RSS Feed
- Permalink
- Report Inappropriate Content
Hello - great to hear - can you please mark the appropriate reply as correct, so our team knows that you have been answered and to your satisfaction?
In regards to when to use script - or use the master items (measures / dimensions section) - that is a very good question. I will raise this with our Products team
Kind Regards,
Mike T
Qlik
Mike Tarallo
Qlik
- Mark as New
- Bookmark
- Subscribe
- Mute
- Subscribe to RSS Feed
- Permalink
- Report Inappropriate Content
Hello Michael
Sure and I look forward for the concept of when to use script - or use the master items (measures / dimensions section). Thank you very much for your help.
- « Previous Replies
-
- 1
- 2
- Next Replies »