Unlock a world of possibilities! Login now and discover the exclusive benefits awaiting you.
- Qlik Community
- :
- All Forums
- :
- QlikView App Dev
- :
- Re: help with a pivot-table
- Subscribe to RSS Feed
- Mark Topic as New
- Mark Topic as Read
- Float this Topic for Current User
- Bookmark
- Subscribe
- Mute
- Printer Friendly Page
- Mark as New
- Bookmark
- Subscribe
- Mute
- Subscribe to RSS Feed
- Permalink
- Report Inappropriate Content
help with a pivot-table
Hi everybody,
I need a (simple) information how to get the following result in an qlikview-pivot table.
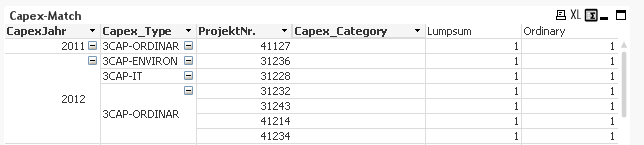
This is my Qlikview-Pivot now, there is not calculation. I put fix a '1' in it.
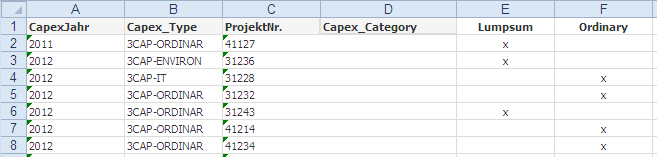
But I want to have it like below. What do I have to do?
Thanks for you help in advance.
- Mark as New
- Bookmark
- Subscribe
- Mute
- Subscribe to RSS Feed
- Permalink
- Report Inappropriate Content
Is the Excel Column E & F based on calculations or those are hard writen value?
If that's values only you can create Table Box in Qlikview instead of PT
- Mark as New
- Bookmark
- Subscribe
- Mute
- Subscribe to RSS Feed
- Permalink
- Report Inappropriate Content
Hi Robert,
no this are not hard-written values. I have for every ProjektNr. the Info CapexCatagory and CapexType.
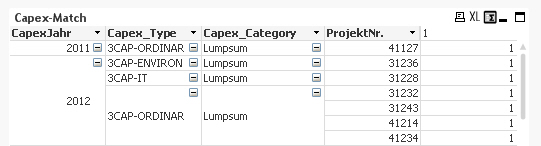
But CapexCatagory should appear like in my first post. Please find below the same Table without Pivot.
- Mark as New
- Bookmark
- Subscribe
- Mute
- Subscribe to RSS Feed
- Permalink
- Report Inappropriate Content
It seems u are not looking for Grouping the data base on dimension.
If this is the case use the Straight table instead of Pivot Table.
- Mark as New
- Bookmark
- Subscribe
- Mute
- Subscribe to RSS Feed
- Permalink
- Report Inappropriate Content
Use a straight table instead of a pivot table then:
Create mapping load(s) for an indicator i.e.
MapLumpSumIND:
MAPPING LOAD * INLINE [
Project, LumpSum
41127, 'X'
31236, 'X'
31243, 'X'
];
Apply the MAP in your fact
APPLYMAP('MapLumpSum',ProjeckNr.,' ') AS LumpSumIND,