Unlock a world of possibilities! Login now and discover the exclusive benefits awaiting you.
- Qlik Community
- :
- All Forums
- :
- QlikView App Dev
- :
- Need help with the Aggr function
- Subscribe to RSS Feed
- Mark Topic as New
- Mark Topic as Read
- Float this Topic for Current User
- Bookmark
- Subscribe
- Mute
- Printer Friendly Page
- Mark as New
- Bookmark
- Subscribe
- Mute
- Subscribe to RSS Feed
- Permalink
- Report Inappropriate Content
Need help with the Aggr function
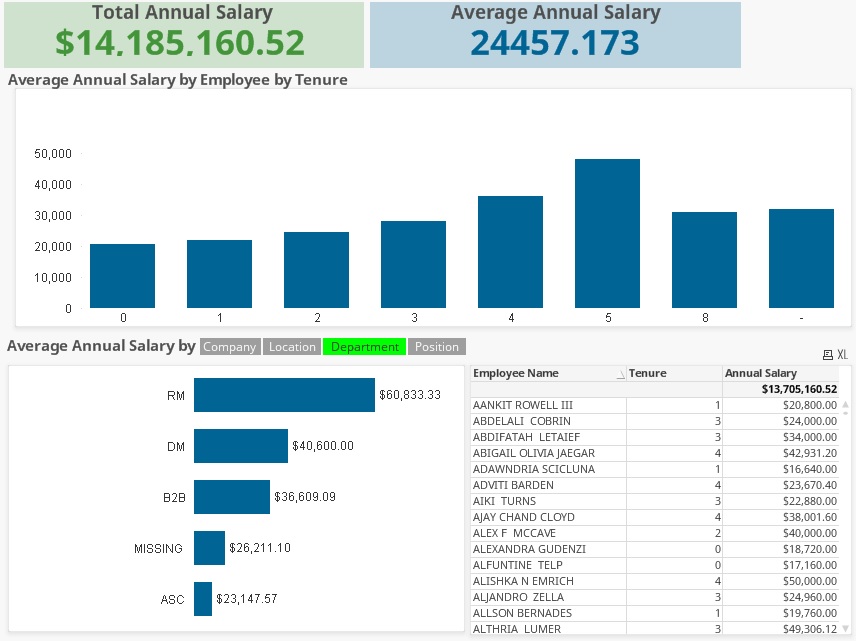
I am having an issue trying to get a formula I put in a textbox to match up to a sum of rows in a chart. As you can see from the image below, my sum of rows is $13,705,160.52.
Here is the formula I'm using:
=if(Year= $(=Max(Year)) and num(Month)= $(=Max(Month)) and ActiveEmployeeYN = 1 ,[Annual Salary])
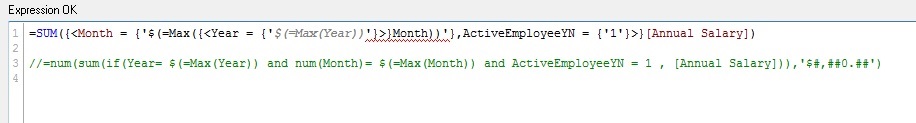
In the green textbox above, I'm using the exact same formula but add sum and formatting:
=num(sum(if(Year= $(=Max(Year)) and num(Month)= $(=Max(Month)) and ActiveEmployeeYN = 1 , [Annual Salary])),'$#,##0.##')
Can someone please tell me what I'm doing wrong? I believe I need to use the Aggr function, but anytime I use it, my value is 0. Thanks for your help
- « Previous Replies
-
- 1
- 2
- Next Replies »
- Mark as New
- Bookmark
- Subscribe
- Mute
- Subscribe to RSS Feed
- Permalink
- Report Inappropriate Content
Can you provide 5-10 lines of sample data please?
- Mark as New
- Bookmark
- Subscribe
- Mute
- Subscribe to RSS Feed
- Permalink
- Report Inappropriate Content
I'm not sure I understand what you want. The chart on the bottom right is what I'm using for the data.
- Mark as New
- Bookmark
- Subscribe
- Mute
- Subscribe to RSS Feed
- Permalink
- Report Inappropriate Content
Here is a spreadsheet that includes the data
- Mark as New
- Bookmark
- Subscribe
- Mute
- Subscribe to RSS Feed
- Permalink
- Report Inappropriate Content
Try below
=SUM({<Month = {'$(=Max({<Year = {'$(=Max(Year))'}>}Month))'},ActiveEmployeeYN = {'1'}>}[Annual Salary])
- Mark as New
- Bookmark
- Subscribe
- Mute
- Subscribe to RSS Feed
- Permalink
- Report Inappropriate Content
it's showing an error in the expression window, and showing a 0 value in the text box.
- Mark as New
- Bookmark
- Subscribe
- Mute
- Subscribe to RSS Feed
- Permalink
- Report Inappropriate Content
Create an Inline Table as below
Load * Inline
[
Month, MonthNo
Jan, 1
Feb, 2
Mar, 3
];
Upto Dec 12 and use MonthNo instead of Month...
Let me know if still not working for you.
- Mark as New
- Bookmark
- Subscribe
- Mute
- Subscribe to RSS Feed
- Permalink
- Report Inappropriate Content
Same issue, MonthNo is still underlined in red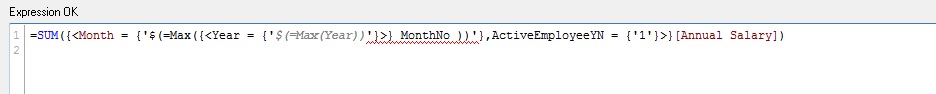
- Mark as New
- Bookmark
- Subscribe
- Mute
- Subscribe to RSS Feed
- Permalink
- Report Inappropriate Content
=Month = {"$(=Max({<Year = {'$(=Max(Year))'}>}MonthNo))"}
- Mark as New
- Bookmark
- Subscribe
- Mute
- Subscribe to RSS Feed
- Permalink
- Report Inappropriate Content
I still get an error. I've attached the qvw. I hope this helps
- « Previous Replies
-
- 1
- 2
- Next Replies »