Unlock a world of possibilities! Login now and discover the exclusive benefits awaiting you.
- Qlik Community
- :
- Forums
- :
- Groups
- :
- Industry and Topics
- :
- Scalability
- :
- Re: Graphs under Printsheet empty !!
- Subscribe to RSS Feed
- Mark Topic as New
- Mark Topic as Read
- Float this Topic for Current User
- Bookmark
- Subscribe
- Mute
- Printer Friendly Page
- Feature this Topic
- Mark as New
- Bookmark
- Subscribe
- Mute
- Subscribe to RSS Feed
- Permalink
- Report Inappropriate Content
Graphs under Printsheet empty !!
Hey,
My Private Bytes graph(for QVWS and IIS) , Working Set Graph(for QVWS and IIS) , CPU(for QVWS and IIS) under print sheet is empty. WHy is it so ?
My QVSa nd QVWS arre both same so i made one data collector and started it. But no values are being shown . Why is it so ??
ALso i am not geting session file.
THanks
- Tags:
- Group_Discussions
- Mark as New
- Bookmark
- Subscribe
- Mute
- Subscribe to RSS Feed
- Permalink
- Report Inappropriate Content
Jmeter will perform actions even if the end result fails. It basically sends those requests and measure the time to get the response ( even if that is an error code). Jmeter will send http requests to the QVS and the request will be seen as failed if the return is for example 400 Bad Request or 401 Unauthorized. The time to get that response will still be measured. To see what the errors you get are, you can check the requests and responses with the view resulst tree component. If you want more in depth detail about jmeter then head over to Apache JMeter - Apache JMeter™.
It acts as a browser, but does not run through a browser so you do not need to configure your browser and your preferred browser to access QMC does not matter
As for the script, select the option which corresponds to you QMC setup. That means which Authorization/Authentication your system is setup to use. If authentication is NTLM then use NTLM, if you have header then select that option.
If access is restricted in any way not handled by the script (login windows could be that), then that can be the reason for getting failures. Running out of licenses will of course also lead to errors.
There is also a possibility that your setup is not supported in the tools.
- Mark as New
- Bookmark
- Subscribe
- Mute
- Subscribe to RSS Feed
- Permalink
- Report Inappropriate Content
Hi,
Yes that is likely cause for the errors. It seems that not the full url have been pasted in scalability tools or there are special characters in the url that prevents proper parsing of the url into parameters in the jmeter script.
There is an example url in the documentation that looks like:
http://servername/QvAJAXZfc/opendoc.htm?document=DemoApplications/Online_Sales.qvw&host=Local
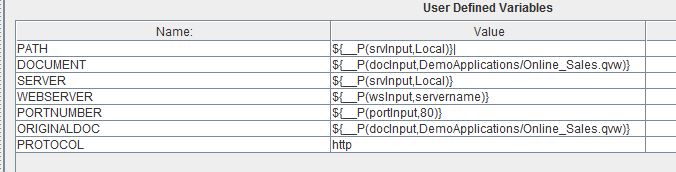
If that is pasted in the latest uploaded scalability tools (version 0.8) and then opened in jmeter it looks like this:
- Mark as New
- Bookmark
- Subscribe
- Mute
- Subscribe to RSS Feed
- Permalink
- Report Inappropriate Content
Hey,
Thanks .In my QMc under authentication tab, Allow anonymous is selected and NTFS is selected(not DMS). But since sessions are created so i think i ma being authenticated using NTLM. Number of clicks are there on webserver but since server variable name is empty and path contains only | , i think that causes my requests to fail because after clicking on acess point which is hosted on webserver , requests goes to qlikview server(here it is server variable) whose value is empty.
- Mark as New
- Bookmark
- Subscribe
- Mute
- Subscribe to RSS Feed
- Permalink
- Report Inappropriate Content
Hey,
I have completed the stress testing with QVScalability tool. I was not getting the cpu , ram usage because i was not changing the timezone. Now i can see every graph . This tool really makes work so easier . It rocks.
One last thing i would like to know:
In QVScalability tool_0_8 version , i everytime i fetch log files, a new folder with logs created. So everytime i have to create copy of SC_Results<Mainfolder>. Do we have some method by which my all analysis can be done within single SC_Results, because then i would not be able to compare between different analysis.
- Mark as New
- Bookmark
- Subscribe
- Mute
- Subscribe to RSS Feed
- Permalink
- Report Inappropriate Content
Also i would like to know when i created test for 1000 users with duration infinity and rampup 5 sec and iteration 1, after some time in Sample window there was message:
Java.lang.outofhep memory.
Dumping heap to java
Heap dump file created.
What does it means
Thanks
- Mark as New
- Bookmark
- Subscribe
- Mute
- Subscribe to RSS Feed
- Permalink
- Report Inappropriate Content
I assume you are using the log collector in the Scalability Tools, in that case you can change the output folder for the logs. Also, you can always manually copy the files you need to your analysis folder.
- Mark as New
- Bookmark
- Subscribe
- Mute
- Subscribe to RSS Feed
- Permalink
- Report Inappropriate Content
Also i would like to know when i created test for 1000 users with duration infinity and rampup 5 sec and iteration 1, after some time in Sample window there was message:
Java.lang.outofhep memory.
Dumping heap to java
Heap dump file created.
What does it means
Thanks
- Mark as New
- Bookmark
- Subscribe
- Mute
- Subscribe to RSS Feed
- Permalink
- Report Inappropriate Content
Jmeter runs through java, and if the jmeter instance requires too much memory (like in this case) the java process will crash. You might mitigate the issue by allocating more heap memory to the jmeter instances (default is 3GB). This is done on the execution tab, advanced options, in the tools. Amount of memory needed will depend on the size of the script - amount of actions, and amount of threads running concurrently (users).
A comment on your settings however as this is important. 1000 users with 5 seconds rampup means that you are simulating 200 users accessing the document every second up to the point where you have 1000 simultaneous users performing selections at the same time. That is in my experience not a realistic real life scenario when it comes to rampup (chunks of 200 users over a few seconds then suddenly stopping) or concurrent users. It is important to understand what 1000 concurrent users mean, as it is not the same as 1000 concurrent sessions.
A session lives per default for 30 minutes, which means that you can simulate 1000 active sessions by (for example) running 100 concurrent users with 10 iterations. Once one user finishes it's scenario it will start over with a new session. This way you will simulate constant load on the server but require less RAM to be allocated to jmeter to handle the threads and it is likely a more realistic scenario. 1000 concurrent users on the other hand means that you will in effect have 1000 requests sent at the same time, hammering the server.
Going back to your scenario, so what you are simulating is a huge amount of users accessing the document in a very short timespan (5s rampup). All of those users will perform actions specified in your scenario only once and then stop (1 iteration). It will not matter if the duration is infinite as you are only simulating 1 run through of the scenario per user. Depending on the length of the scenario you are basically simulating a burst of activity over a timespan of seconds-minutes. Is this the objective of the test or is it to measure how the performance is when a constant stream of users (realistically set in regards to numbers) acess a document over a period of time? So what I want to come to is that it is very important to think of what a realistic scenario is, and think twice of that the settings provided actually will mean
/sebastian.
- Mark as New
- Bookmark
- Subscribe
- Mute
- Subscribe to RSS Feed
- Permalink
- Report Inappropriate Content
Hey,
Thanks but i would like to clear a doubt about Rampup Period.
1: If users are 10 and rampup period is 2 sec then does it means that every new user will start in every 2 sec. Means , After 2 sec , 2nd user , after another 2 sec 3rd user and so on ??
And Does No fo actions and No of clicks are different ?
Under MAin , relative time Tab:
2: In Actions,AvgResponseTime: A horizontal line is always there in every test. What does it signifies ??
3: In #Request tab , what does MS,elapsed Means? What does it signifies ?
Under Main,CalendarTime tab:
4: In Errors per server , What kind of errors are they? Because for same document in Troubleshoot sheet i am getting 0% Error.
5: In JmeterOpenDoc and QVSSessions , i am getting different values of no of sessions. Why is it so? At a particular time ,number of sessions in JmeterOpenDoc and in QVSsessions are different . They should be equal. Right ? Because threads(sessions) are being created by Jmeter.
6: In session started , what does W3WP means?
Under Troubleshoot,
7: What does append logs show?
Thanks
- Mark as New
- Bookmark
- Subscribe
- Mute
- Subscribe to RSS Feed
- Permalink
- Report Inappropriate Content
1. No, rampup is the time to start ALL threads. From the documentation: "Ramp up – Time in seconds needed to start all threads (users). A ramp up value of 30 and Concurrent users value of 10 means that one user (thread) is started every third second." In your case (10 users, 2 sec rampup) you are starting 5 threads the first second, and then 5 more the second second.
2. It is the average lines for the tests in that graph
3. Number of clicks within the specified millisecond intervals.
4. Those are number of messages in the qlikview event log that are not marked as "Information". It counts the number of errors and warnings reported by QV. What I think you are looking at in the troubleshoot tab is the responses your simulation (jmeter) gets.
5. Two likely reasons: JmeterOpenDoc will not be logged as a qlikview session if it fails. The second reason is that the sessions are written to the sessionlog when the session times out (default 30minutes) or when the qvs is restarted.
6. I don't know which tab you are on but W3WP is IIS.
7. It's an old chart used to detect common mistakes that now handles by the tools. (so disregard it)
It seems like you are focusing very much on details., Most of the value can be taken from the printsheet graphs (after verifying that the test is relevant and accurate).