Unlock a world of possibilities! Login now and discover the exclusive benefits awaiting you.
- Qlik Community
- :
- All Forums
- :
- QlikView App Dev
- :
- Re: Line Chart
- Subscribe to RSS Feed
- Mark Topic as New
- Mark Topic as Read
- Float this Topic for Current User
- Bookmark
- Subscribe
- Mute
- Printer Friendly Page
- Mark as New
- Bookmark
- Subscribe
- Mute
- Subscribe to RSS Feed
- Permalink
- Report Inappropriate Content
Line Chart
Hi Experts
I have the following problem:
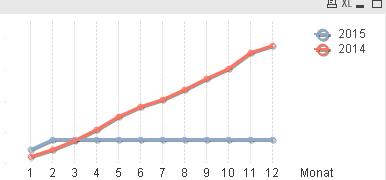
I want to display sales data of 2014 and the current year in a cumalative line chart. Of course, for 2015 there is only data for January and February. But the line is continued at the same level until December. How can I prevent this?
Thank you for your help!
Jan
Accepted Solutions
- Mark as New
- Bookmark
- Subscribe
- Mute
- Subscribe to RSS Feed
- Permalink
- Report Inappropriate Content
Go to the Expression Tab and for 2015 click on +
Under Background color, write below condition
IF(Month<= Month(Today()),Blue(),White())
- Mark as New
- Bookmark
- Subscribe
- Mute
- Subscribe to RSS Feed
- Permalink
- Report Inappropriate Content
Go to the Expression Tab and for 2015 click on +
Under Background color, write below condition
IF(Month<= Month(Today()),Blue(),White())
- Mark as New
- Bookmark
- Subscribe
- Mute
- Subscribe to RSS Feed
- Permalink
- Report Inappropriate Content
What expression are you currently using for 2015? May be there is a way to restrict the line within the expression itself.
Best,
S
- Mark as New
- Bookmark
- Subscribe
- Mute
- Subscribe to RSS Feed
- Permalink
- Report Inappropriate Content
Brilliant! Thank you!
- Mark as New
- Bookmark
- Subscribe
- Mute
- Subscribe to RSS Feed
- Permalink
- Report Inappropriate Content
Hi Sunindia
Sum ({<Jahr={$(VaktJahr)}>} ([Rohertrag_BA]))
Thank you for your help!