Unlock a world of possibilities! Login now and discover the exclusive benefits awaiting you.
- Qlik Community
- :
- Forums
- :
- Analytics
- :
- New to Qlik Analytics
- :
- Re: Sum by Month
- Subscribe to RSS Feed
- Mark Topic as New
- Mark Topic as Read
- Float this Topic for Current User
- Bookmark
- Subscribe
- Mute
- Printer Friendly Page
- Mark as New
- Bookmark
- Subscribe
- Mute
- Subscribe to RSS Feed
- Permalink
- Report Inappropriate Content
Sum by Month
I am new to QlikSense Desktop.
I have an Excel-Sheet that contains DATE, AMOUNT, PURPOSE.
I want to create an line chart that sums up the AMOUNT by MONTH.
I do not have any problems creating the chart, but the row will contain every DATE. Any suggestions on how to sum this up?
Thanks in advance,
Andy
Accepted Solutions
- Mark as New
- Bookmark
- Subscribe
- Mute
- Subscribe to RSS Feed
- Permalink
- Report Inappropriate Content
Let me mention that in addition to everything suggested before, you probably need to calculate Month-Year, not just a month, if your data includes multiple years. In this case, use the following calculation in your load script:
...
Date(MonthStart(DATE), 'MMM-YYYY') as MonthYear,
...
- Mark as New
- Bookmark
- Subscribe
- Mute
- Subscribe to RSS Feed
- Permalink
- Report Inappropriate Content
How you are creating MONTH from DATE field?
Use Month(DATE) as MONTH...
- Mark as New
- Bookmark
- Subscribe
- Mute
- Subscribe to RSS Feed
- Permalink
- Report Inappropriate Content
In the load script, add the month field:
load
FieldA,
FieldB,
Date,
month(Date) as Month
from source;
Now you can use Month as a dimension in your chart instead of the Date.
- Mark as New
- Bookmark
- Subscribe
- Mute
- Subscribe to RSS Feed
- Permalink
- Report Inappropriate Content
Try
sum(${<DATE={Month(DATE)}>}AMOUNT)
- Mark as New
- Bookmark
- Subscribe
- Mute
- Subscribe to RSS Feed
- Permalink
- Report Inappropriate Content
Hi Mueller,
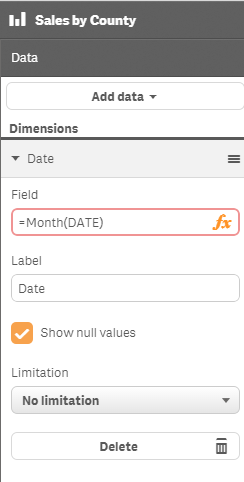
There are two way you can do this. You can calculate the months on the fly by using the month function directly in the dimension.
Or
When you load your data you can precalculate the months. You do this by using the expression
Month(DATE) as Month
in your load script. Data Load Editor Walkthrough (video) goes through how to us the data load editor. At 1:56 the video specifically show how to calculate months from a date.
You may also with to review other videos on our New to Qlik Sense Videos area.
Please mark my response as correct or helpful if appropriate so other can find the answer to their questions.
-Josh
Qlik
- Mark as New
- Bookmark
- Subscribe
- Mute
- Subscribe to RSS Feed
- Permalink
- Report Inappropriate Content
Let me mention that in addition to everything suggested before, you probably need to calculate Month-Year, not just a month, if your data includes multiple years. In this case, use the following calculation in your load script:
...
Date(MonthStart(DATE), 'MMM-YYYY') as MonthYear,
...