Unlock a world of possibilities! Login now and discover the exclusive benefits awaiting you.
- Qlik Community
- :
- All Forums
- :
- QlikView App Dev
- :
- Re: Expressions Defenition Gauge Chart
- Subscribe to RSS Feed
- Mark Topic as New
- Mark Topic as Read
- Float this Topic for Current User
- Bookmark
- Subscribe
- Mute
- Printer Friendly Page
- Mark as New
- Bookmark
- Subscribe
- Mute
- Subscribe to RSS Feed
- Permalink
- Report Inappropriate Content
Expressions Defenition Gauge Chart
Hi,
I've made a gauge chart that shows how much % electricity that is saved (oldest selected year vs latest selected year), but the color will not change as the percentage change.
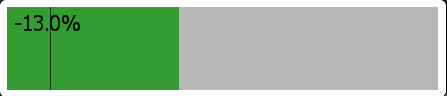
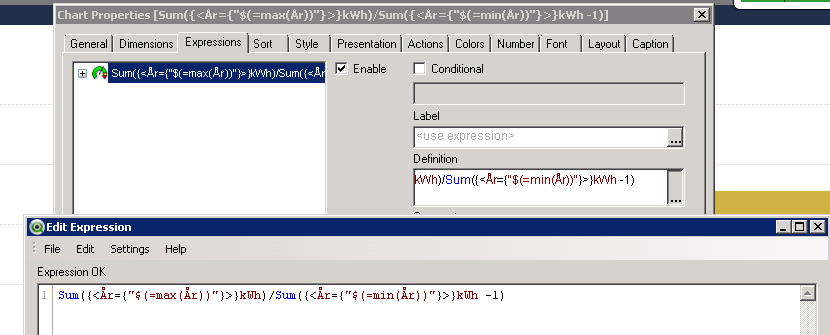
Text in Chart: =num(sum({<År={"$(=max(År))"}>}kWh)/sum({<År={"$(=min(År))"}>}kWh)-1,'#.0%')
I need help with the definition of the expression (see picture)
__________________________________________________________________________________________
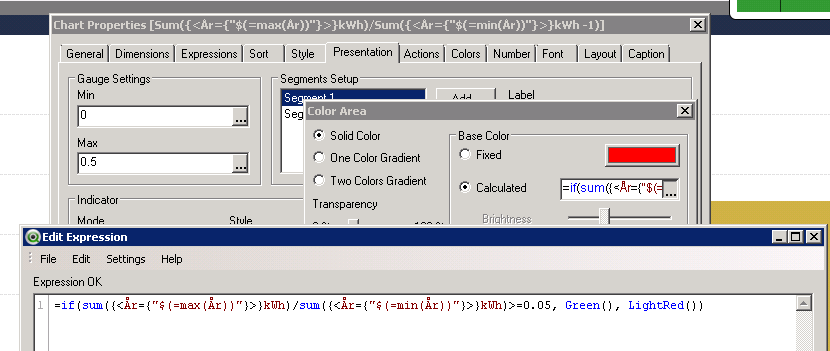
some more screenshots:
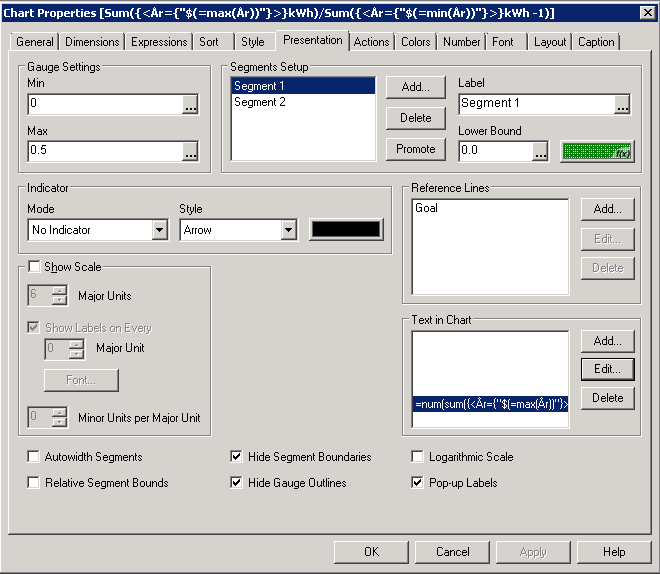
Segment 1:
- Mark as New
- Bookmark
- Subscribe
- Mute
- Subscribe to RSS Feed
- Permalink
- Report Inappropriate Content
I think you want to use the "Fill to Value" Indicator Mode,or you can just put your expression as the Lower Bound for your 2nd segment and keep the Indicator Mode "No Indicator" like you have.
- Mark as New
- Bookmark
- Subscribe
- Mute
- Subscribe to RSS Feed
- Permalink
- Report Inappropriate Content
The attached may help