Unlock a world of possibilities! Login now and discover the exclusive benefits awaiting you.
- Qlik Community
- :
- All Forums
- :
- QlikView App Dev
- :
- How to remove the total
- Subscribe to RSS Feed
- Mark Topic as New
- Mark Topic as Read
- Float this Topic for Current User
- Bookmark
- Subscribe
- Mute
- Printer Friendly Page
- Mark as New
- Bookmark
- Subscribe
- Mute
- Subscribe to RSS Feed
- Permalink
- Report Inappropriate Content
How to remove the total
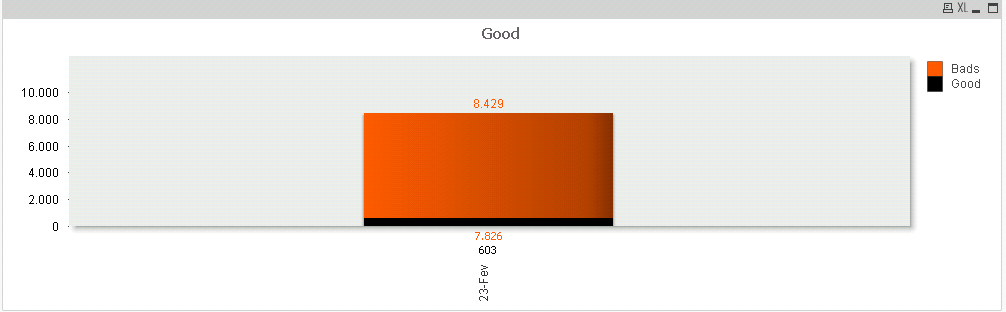
There are 2 measurements (good and bads). The count of good is 600 and the total of bad is 7826 and I only want this two numbers. How can I remove the total 8429 number form the chart?
If possible the position of the 7826 (bads) should be on the position of the 8429 (which is the total).
- « Previous Replies
- Next Replies »
- Mark as New
- Bookmark
- Subscribe
- Mute
- Subscribe to RSS Feed
- Permalink
- Report Inappropriate Content
Do you have show values on data points ticked?
- Mark as New
- Bookmark
- Subscribe
- Mute
- Subscribe to RSS Feed
- Permalink
- Report Inappropriate Content
Pedro, could you post the expressions options like show values on data points etc.?
That way we could help you better...
- Mark as New
- Bookmark
- Subscribe
- Mute
- Subscribe to RSS Feed
- Permalink
- Report Inappropriate Content
Hi,
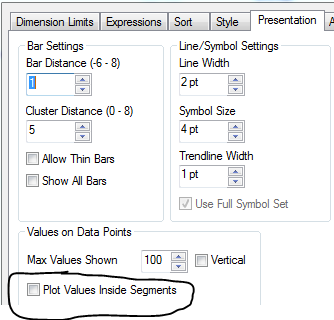
Have you tried Ticking the "Plot values Inside segments?"
- Mark as New
- Bookmark
- Subscribe
- Mute
- Subscribe to RSS Feed
- Permalink
- Report Inappropriate Content
Just as Jonathan Penuliar mentioned, put a tick mark on 'Plot Values Inside Segments' within the Presentation tab of Chart Properties.
Best,
S
- Mark as New
- Bookmark
- Subscribe
- Mute
- Subscribe to RSS Feed
- Permalink
- Report Inappropriate Content
I tried, but it doesnt remove the total value.
- Mark as New
- Bookmark
- Subscribe
- Mute
- Subscribe to RSS Feed
- Permalink
- Report Inappropriate Content
I post the expressions.
- Mark as New
- Bookmark
- Subscribe
- Mute
- Subscribe to RSS Feed
- Permalink
- Report Inappropriate Content
Yes, I do. And I can add or remove those values from the measurements, however I dont know how to remove the total value (which is equal to good+bad)
- Mark as New
- Bookmark
- Subscribe
- Mute
- Subscribe to RSS Feed
- Permalink
- Report Inappropriate Content
In the image you just posted, the expressions itself are not visible, Only the labels are visible. Can you copy paste the expressions you are using (instead of posting a image)?
Best,
S
- Mark as New
- Bookmark
- Subscribe
- Mute
- Subscribe to RSS Feed
- Permalink
- Report Inappropriate Content
Count({$<Result={"Bads"}>}Dia)
Count({$<Result={"Good"}>}Dia)
These are expressions I am using.
- « Previous Replies
- Next Replies »