Unlock a world of possibilities! Login now and discover the exclusive benefits awaiting you.
- Qlik Community
- :
- All Forums
- :
- QlikView App Dev
- :
- Re: How to remove the total
- Subscribe to RSS Feed
- Mark Topic as New
- Mark Topic as Read
- Float this Topic for Current User
- Bookmark
- Subscribe
- Mute
- Printer Friendly Page
- Mark as New
- Bookmark
- Subscribe
- Mute
- Subscribe to RSS Feed
- Permalink
- Report Inappropriate Content
How to remove the total
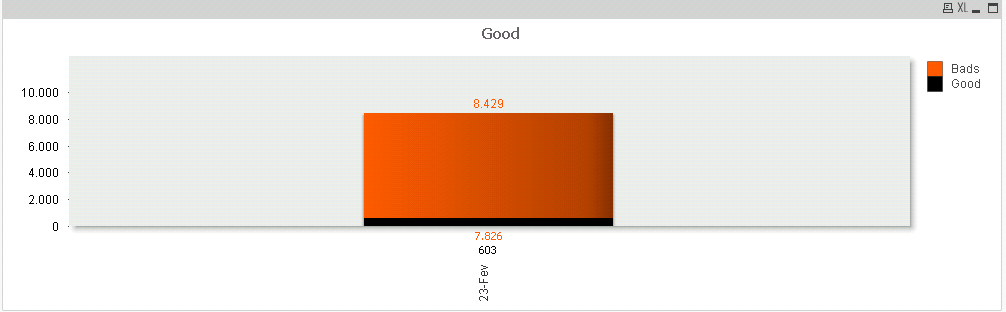
There are 2 measurements (good and bads). The count of good is 600 and the total of bad is 7826 and I only want this two numbers. How can I remove the total 8429 number form the chart?
If possible the position of the 7826 (bads) should be on the position of the 8429 (which is the total).
- Mark as New
- Bookmark
- Subscribe
- Mute
- Subscribe to RSS Feed
- Permalink
- Report Inappropriate Content
Please find attached. Hopefully this will help.
This is what you have:
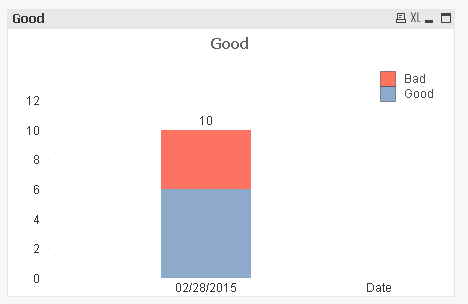
This is what you want?
Best,
S
- Mark as New
- Bookmark
- Subscribe
- Mute
- Subscribe to RSS Feed
- Permalink
- Report Inappropriate Content
It could be a Ref Line or Text in Chart in disguise
- Mark as New
- Bookmark
- Subscribe
- Mute
- Subscribe to RSS Feed
- Permalink
- Report Inappropriate Content
If your chart was cloned from somewhere, a big chance some properties you are not aware of are also in it.
Try creating a new chart and start adding your expressions
- Mark as New
- Bookmark
- Subscribe
- Mute
- Subscribe to RSS Feed
- Permalink
- Report Inappropriate Content
I manage to put both values I want. I selected on both "text on axis". Someone know where I can put both values on the top?
- Mark as New
- Bookmark
- Subscribe
- Mute
- Subscribe to RSS Feed
- Permalink
- Report Inappropriate Content
I had to select "text on axis" for both. However now I dont know how to put the value on the top? The value "Good" with orange colour I want to put on the top of the bar.
Do you know how I can do it?
- Mark as New
- Bookmark
- Subscribe
- Mute
- Subscribe to RSS Feed
- Permalink
- Report Inappropriate Content
I want the secound. I manage to put the values but where can I define their positions?
My qlikview is not licensed, therefore I cant open your qvw.
- Mark as New
- Bookmark
- Subscribe
- Mute
- Subscribe to RSS Feed
- Permalink
- Report Inappropriate Content
Is the second image what you want the chart to look like?
Best,
S
- Mark as New
- Bookmark
- Subscribe
- Mute
- Subscribe to RSS Feed
- Permalink
- Report Inappropriate Content
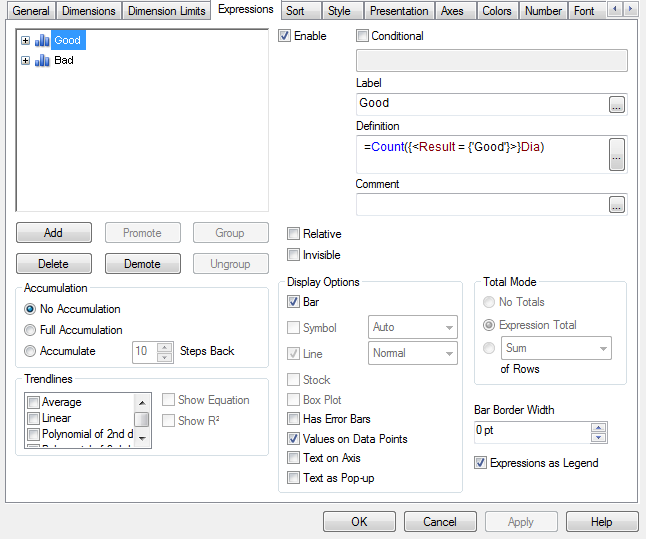
If yes, then this is what I did: Expression tab:
Presentation Tab:

HTH
Best,
S
- Mark as New
- Bookmark
- Subscribe
- Mute
- Subscribe to RSS Feed
- Permalink
- Report Inappropriate Content
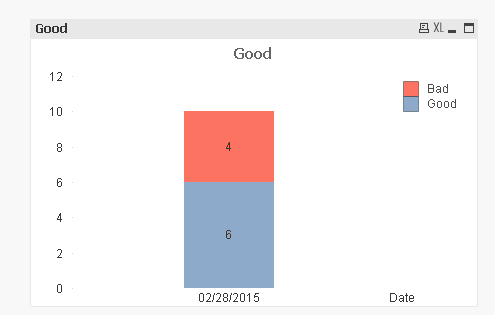
It is smilar to the second image, however I want the value to be on the top of the graph and not on the midle. Do you know where I can change it?
Thanks for the help!
- Mark as New
- Bookmark
- Subscribe
- Mute
- Subscribe to RSS Feed
- Permalink
- Report Inappropriate Content
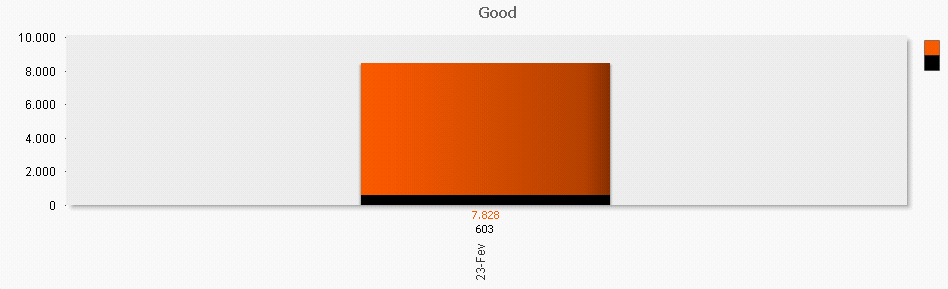
Is this what you want?

Best,
S