Unlock a world of possibilities! Login now and discover the exclusive benefits awaiting you.
- Qlik Community
- :
- All Forums
- :
- QlikView App Dev
- :
- Re: How to remove the total
- Subscribe to RSS Feed
- Mark Topic as New
- Mark Topic as Read
- Float this Topic for Current User
- Bookmark
- Subscribe
- Mute
- Printer Friendly Page
- Mark as New
- Bookmark
- Subscribe
- Mute
- Subscribe to RSS Feed
- Permalink
- Report Inappropriate Content
How to remove the total
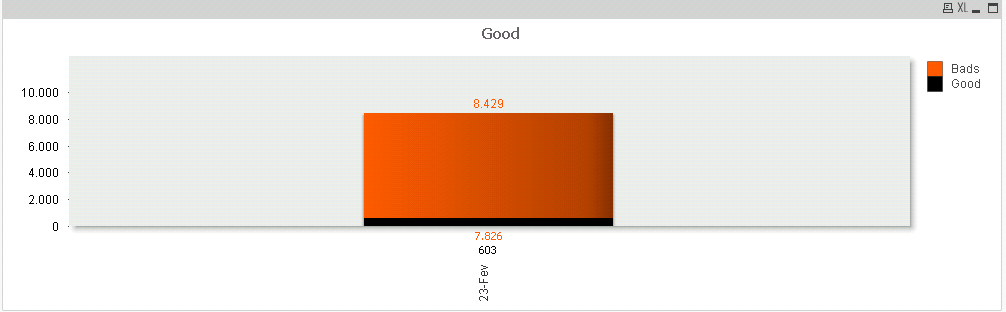
There are 2 measurements (good and bads). The count of good is 600 and the total of bad is 7826 and I only want this two numbers. How can I remove the total 8429 number form the chart?
If possible the position of the 7826 (bads) should be on the position of the 8429 (which is the total).
- Mark as New
- Bookmark
- Subscribe
- Mute
- Subscribe to RSS Feed
- Permalink
- Report Inappropriate Content
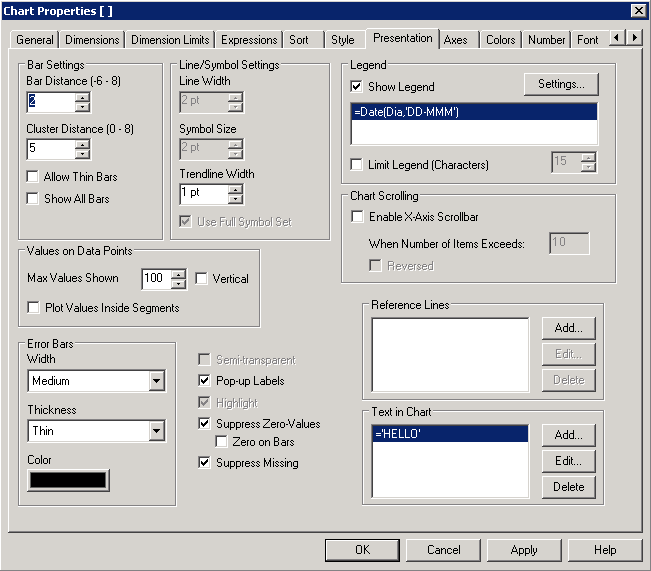
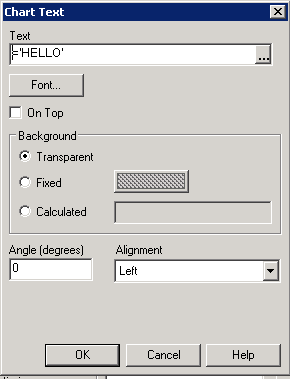
You can use Text in Chart and place the text anywhere you want on your chart. But this won't be very useful if you want to do it on multiple bars. This will end up not being very helpful.
There is no direct way to show each count of good and bad at the top.

HTH
Best,
S
- Mark as New
- Bookmark
- Subscribe
- Mute
- Subscribe to RSS Feed
- Permalink
- Report Inappropriate Content
No. One value I want on the top.
Like this:
- Mark as New
- Bookmark
- Subscribe
- Mute
- Subscribe to RSS Feed
- Permalink
- Report Inappropriate Content
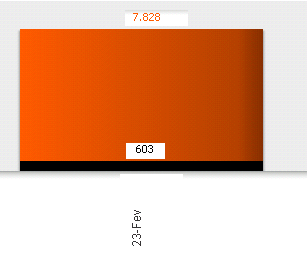
I tried but it did not work.
The output is like this:
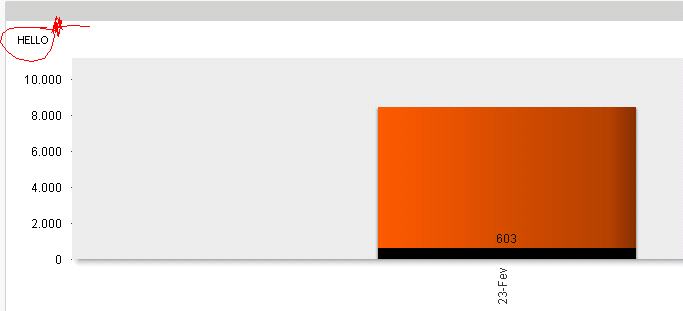
The hello should had been on the top of the bar and not on the top of the graph
- Mark as New
- Bookmark
- Subscribe
- Mute
- Subscribe to RSS Feed
- Permalink
- Report Inappropriate Content
While on the chart, press Ctrl + Shift. It will display red lines on the chart. Then grab the text you just entered and move it on top of the bar.
HTH.
Best,
S
- Mark as New
- Bookmark
- Subscribe
- Mute
- Subscribe to RSS Feed
- Permalink
- Report Inappropriate Content
It is working for one dimension, but how can I do it with multiple dimension?
Like this example:
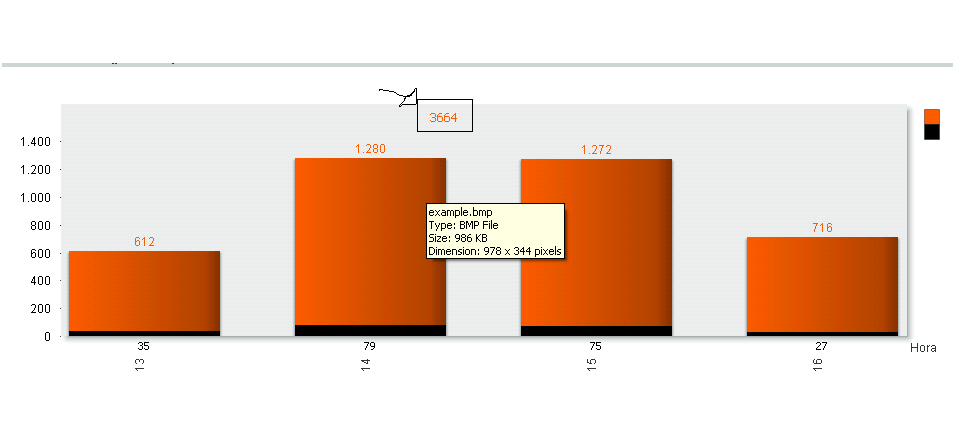
PS. The numbers on the top are the total (i still dont know how to put on the options the value of the measurements on the top.
- Mark as New
- Bookmark
- Subscribe
- Mute
- Subscribe to RSS Feed
- Permalink
- Report Inappropriate Content
I told you that this is going to be an issue. A dirty work around is to add multiple text and place them over each of the bar. I can't think of a better solution.
Hope this helps.
Best,
S
- Mark as New
- Bookmark
- Subscribe
- Mute
- Subscribe to RSS Feed
- Permalink
- Report Inappropriate Content
It will look something like this.

Best,
S
- Mark as New
- Bookmark
- Subscribe
- Mute
- Subscribe to RSS Feed
- Permalink
- Report Inappropriate Content
I can have both values but both appear at on button.
Is there a way to change the position of the "text on axis"? Something like the Ctrl+shit method
- Mark as New
- Bookmark
- Subscribe
- Mute
- Subscribe to RSS Feed
- Permalink
- Report Inappropriate Content
Not Sure what you mean? Can you elaborate please.
Best,
S
- Mark as New
- Bookmark
- Subscribe
- Mute
- Subscribe to RSS Feed
- Permalink
- Report Inappropriate Content
1.click mouse on ur chart,
2.press shift+ctrl and move/drag bottom " text on axis",to where ever u want!