Unlock a world of possibilities! Login now and discover the exclusive benefits awaiting you.
- Qlik Community
- :
- Forums
- :
- Analytics
- :
- New to Qlik Analytics
- :
- Re: Select a field for only a single visualisation...
- Subscribe to RSS Feed
- Mark Topic as New
- Mark Topic as Read
- Float this Topic for Current User
- Bookmark
- Subscribe
- Mute
- Printer Friendly Page
- Mark as New
- Bookmark
- Subscribe
- Mute
- Subscribe to RSS Feed
- Permalink
- Report Inappropriate Content
Select a field for only a single visualisation?
Hi guys,
Is there any way I am able to select a field for only a single visualisation?
For example, I have a table and a bar chart on the same page. The table has a drill-down dimension which goes by
Year > Month > Level 1 > Level 2 > Level 3
So in my table I can view the data of Level 3 for a specific month (eg. December).
However, on my bar chart I use the Month dimension as I want to view the trend of the amounts while the table shows me Level 3 for the selected Month (eg. Table shows me December amounts while bar chart shows me July to December trend).
My problem is that when I drill-down to Level 3 on the table I've already filtered out the other months and can no longer view these on the bar chart at the same time (eg. can only view December, instead of July to December)
Is there any way around this?
- Tags:
- drill-down
- field
- « Previous Replies
-
- 1
- 2
- Next Replies »
- Mark as New
- Bookmark
- Subscribe
- Mute
- Subscribe to RSS Feed
- Permalink
- Report Inappropriate Content
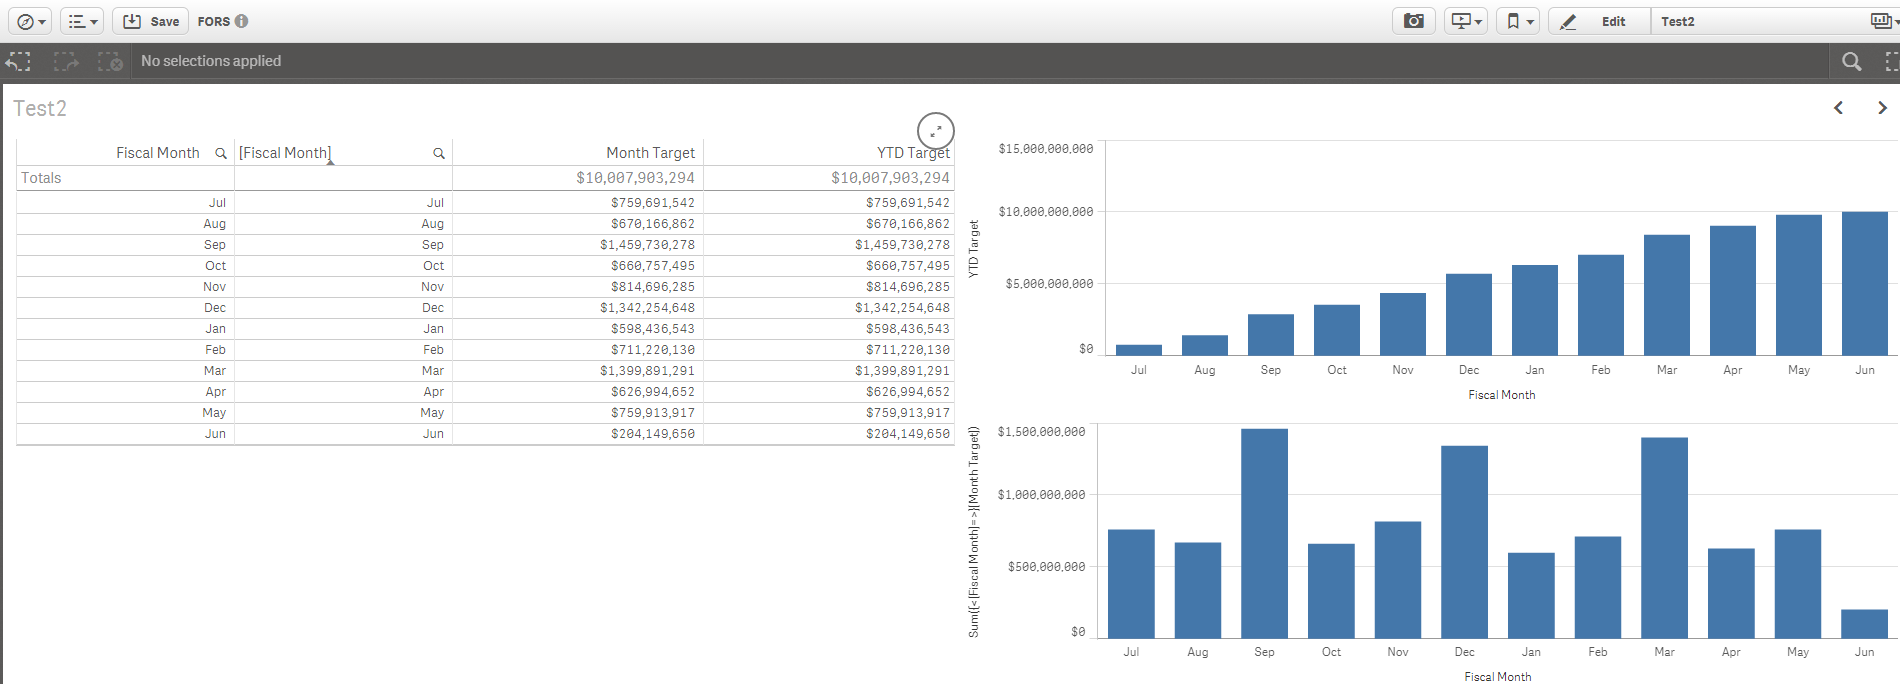
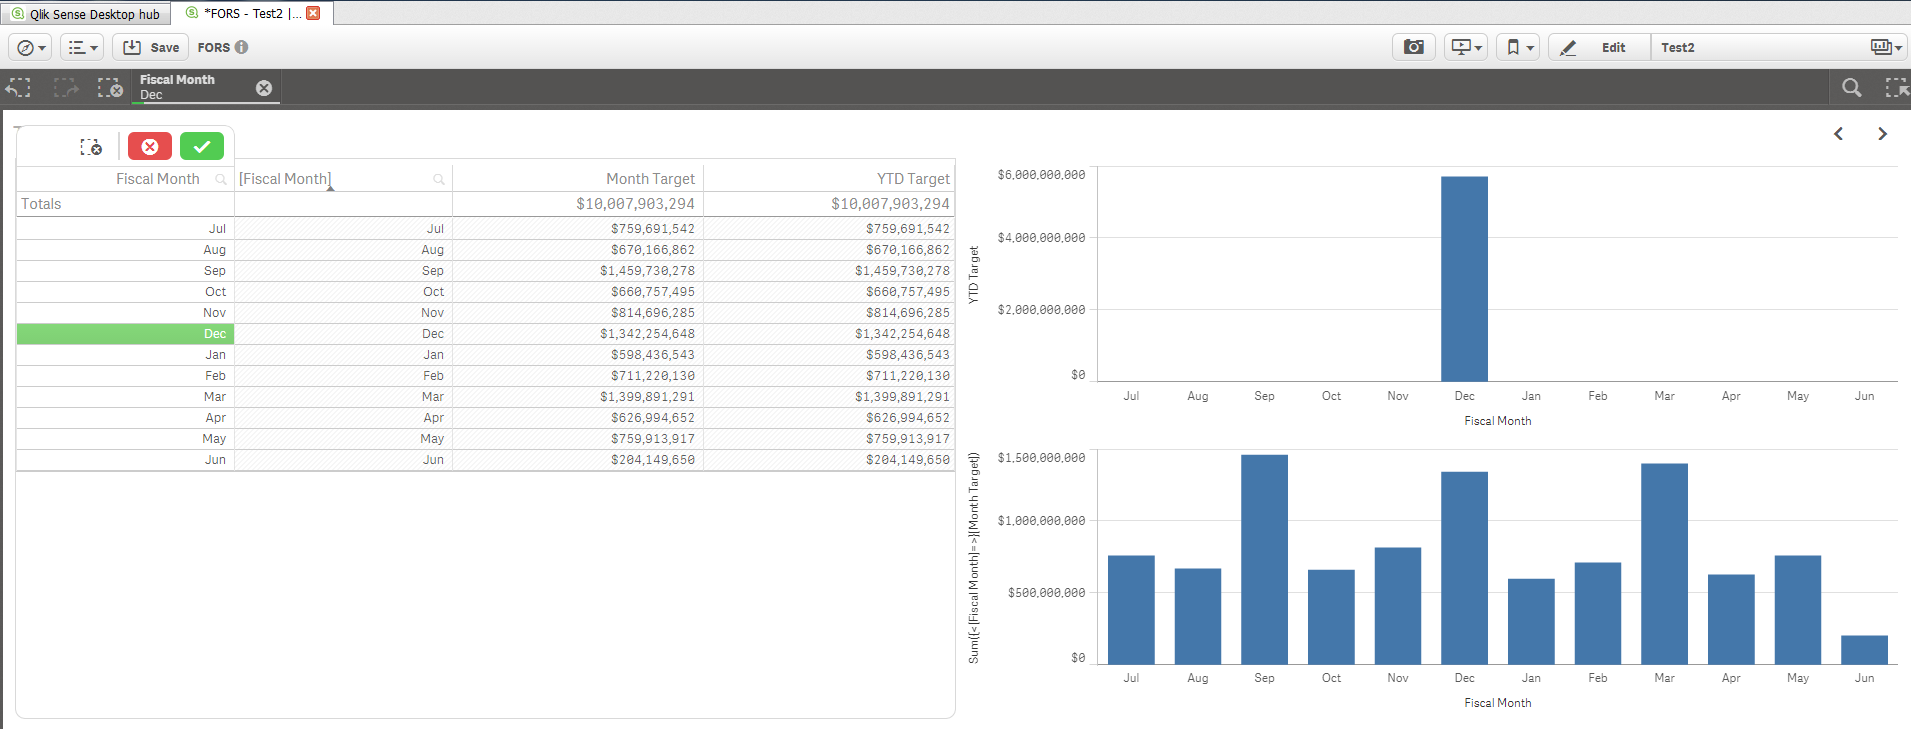
Sorry for the many replies in such a short time but I am having some strange problems which I'll try to explain as best I can.
For my 'YTD Target' I am using a formula to aggregate each of the month values to determine how much has gone into that level from July to whatever month I select.
rangesum(above(SUM({<[Fiscal Month]=>}[Month Target]), 0, [Fiscal Month]))
This works fine in tables and charts when the only dimension is 'Fiscal Month', but when I add in a drill-down dimension (including Fiscal Month as a drill), the amounts don't aggregate.
Another problem is that when I click on a month, the bar chart which uses 'YTD Target' stops displaying data, but the bar chart which uses 'Month Target' remains unaffected.
I believe the error occurs when I use a drill-down dimension with a rangesum expression.
I'm thinking I may have to ditch the drill-down to solve this issue, unless you guys have any other way around it.
Edit:
I should also add that the values in my YTD Target column in the table don't aggregate when the drill-down is in the same table.
- « Previous Replies
-
- 1
- 2
- Next Replies »