Unlock a world of possibilities! Login now and discover the exclusive benefits awaiting you.
- Qlik Community
- :
- All Forums
- :
- QlikView App Dev
- :
- Re: graph in qlikview?
- Subscribe to RSS Feed
- Mark Topic as New
- Mark Topic as Read
- Float this Topic for Current User
- Bookmark
- Subscribe
- Mute
- Printer Friendly Page
- Mark as New
- Bookmark
- Subscribe
- Mute
- Subscribe to RSS Feed
- Permalink
- Report Inappropriate Content
graph in qlikview?
HEY everyone!
I have 3 columns
in the antivirus_daysOld_update there are number of days that the laptop with the 00215F (for example)Netbios_name hasnt been updated
I want to have a graph (Camembert) when I can see the number of laptops that arent been updated more than 200 days old) and the one which the antivirus_daysOld_update is less than 200
Netbios_name serial_number antivirus_daysOld_update
002125F 41F598666 512
g459665 5463S556 50
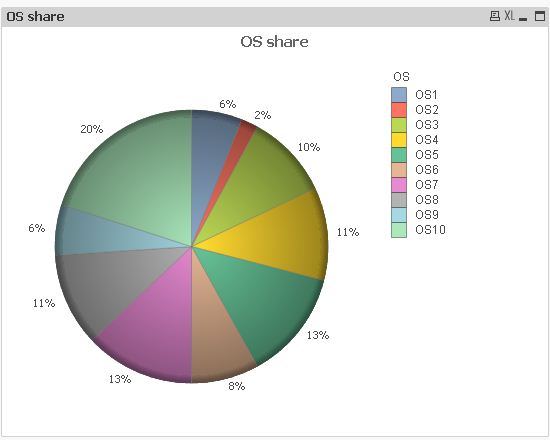
The second question: I want to have in the graph VERSIONS OS the percentage instead of the number on laptop that has OS7 or OS XP.
P.S sorry I have a bad English 
- « Previous Replies
-
- 1
- 2
- Next Replies »
- Mark as New
- Bookmark
- Subscribe
- Mute
- Subscribe to RSS Feed
- Permalink
- Report Inappropriate Content
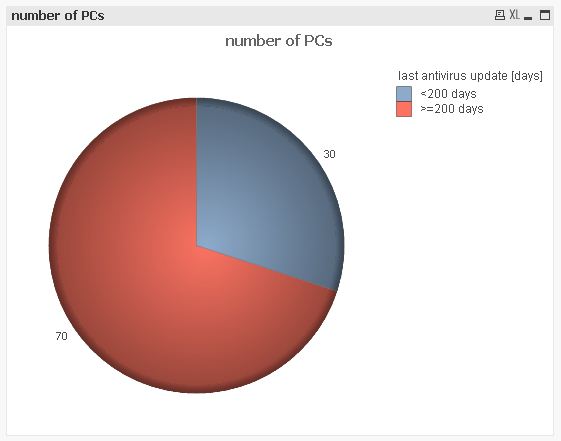
There are no dimensions in the bottom pie chart, but 2 expressions as follows:
=Count({1<AntiVirus_daysOldUpdate={">=200"}>}Serial_number)
=Count({1<AntiVirus_daysOldUpdate={"<200"}>}Serial_number)
- Mark as New
- Bookmark
- Subscribe
- Mute
- Subscribe to RSS Feed
- Permalink
- Report Inappropriate Content
Hi,
I already prepared an example when I noticed this is an old thread:
hope this helps ...
... someone
regards
Marco
- « Previous Replies
-
- 1
- 2
- Next Replies »