Unlock a world of possibilities! Login now and discover the exclusive benefits awaiting you.
- Qlik Community
- :
- All Forums
- :
- QlikView App Dev
- :
- Re: Running/Cumulative Total Calculations
- Subscribe to RSS Feed
- Mark Topic as New
- Mark Topic as Read
- Float this Topic for Current User
- Bookmark
- Subscribe
- Mute
- Printer Friendly Page
- Mark as New
- Bookmark
- Subscribe
- Mute
- Subscribe to RSS Feed
- Permalink
- Report Inappropriate Content
Running/Cumulative Total Calculations
Dear All
I am using QV to calculate impact of the spare part and service costs compared to the production.
My raw data has Product, Month, Year, Supplier, Production, Service & Spares.
For each product, I want to calculate the impact of spare parts and service cost compared to the production level and how it change month by month.
By using a Pivot Chart, I can obtain exactly what I looking for.
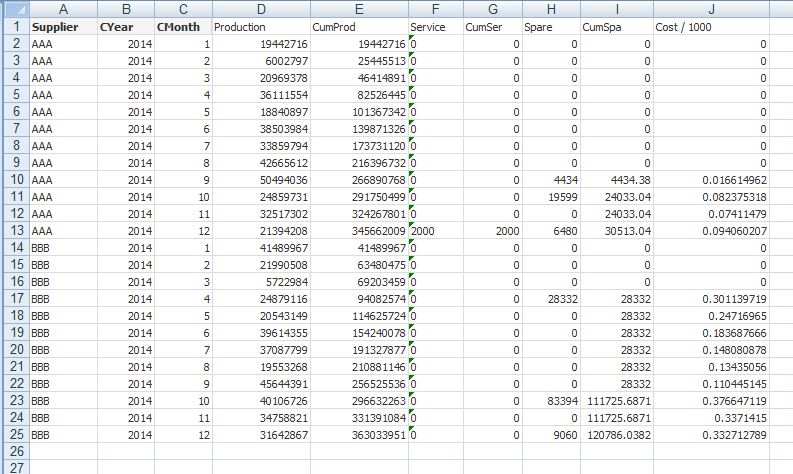
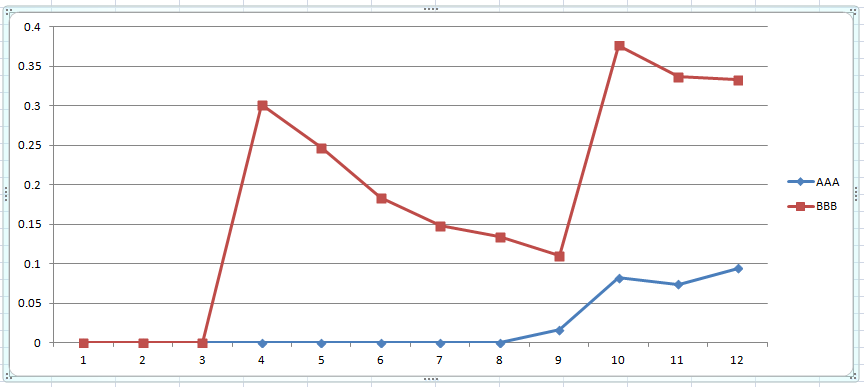
When I want to put in a line chart the column "cost / 1000", the cumulative functionality is not working anymore.
The formula I am using for Cost / 1000 is:
if(rangesum(above(sum(Production),0,RowNo()))=0,0,(rangesum(above(sum(Service),0,RowNo()))+rangesum(above(sum(Spare),0,RowNo())))*1000/rangesum(above(sum(Production),0,RowNo())))
Please let me know if the formula used for the line chart should be different.
What I want to obtain is:
Thanks in advance.
Felipe
Accepted Solutions
- Mark as New
- Bookmark
- Subscribe
- Mute
- Subscribe to RSS Feed
- Permalink
- Report Inappropriate Content
Maybe my similar issue can help you out. Using AsOfTables is a smart way to control your cumulations.
- Mark as New
- Bookmark
- Subscribe
- Mute
- Subscribe to RSS Feed
- Permalink
- Report Inappropriate Content
Perhaps this document helps: Calculating rolling n-period totals, averages or other aggregations
If not, please post a qlikview document that demonstrates the problem.
talk is cheap, supply exceeds demand
- Mark as New
- Bookmark
- Subscribe
- Mute
- Subscribe to RSS Feed
- Permalink
- Report Inappropriate Content
Maybe my similar issue can help you out. Using AsOfTables is a smart way to control your cumulations.
- Mark as New
- Bookmark
- Subscribe
- Mute
- Subscribe to RSS Feed
- Permalink
- Report Inappropriate Content
of course it was @gwassenaar who help me out that time... Thanks again...
- Mark as New
- Bookmark
- Subscribe
- Mute
- Subscribe to RSS Feed
- Permalink
- Report Inappropriate Content
Dear Gysbert
Attached you can find a QV file on which you can see a pivot chart and a line chart.
I will like to put on the line chart the column "Cost / 1000" of the pivot chart but when I use the same expression, the Line chart doesn't show the cumulative results.
If(RangeSum(above(sum(Production),0,12))=0,0,
(RangeSum(above(sum(Service),0,12))+RangeSum(above(sum(Spare),0,12)))*1000 / RangeSum(above(sum(Production),0,12)))
I am not sure if the formula can be used also on a line chart.
Please let me know.
thanks in advance
Felipe
- Mark as New
- Bookmark
- Subscribe
- Mute
- Subscribe to RSS Feed
- Permalink
- Report Inappropriate Content
Use "before" instead of "above" in a chart.
If(RangeSum(before(sum(Production),0,12))=0,0,
(RangeSum(before(sum(Service),0,12))+RangeSum(before(sum(Spare),0,12)))*1000 / RangeSum(before(sum(Production),0,12)))
- Mark as New
- Bookmark
- Subscribe
- Mute
- Subscribe to RSS Feed
- Permalink
- Report Inappropriate Content
Dear Linus
I have tried using "before" instead of "above" with no results...(no lines in the chart).
- Mark as New
- Bookmark
- Subscribe
- Mute
- Subscribe to RSS Feed
- Permalink
- Report Inappropriate Content
Dear All
I have solved this issue using AsOf tables.
See as reference: Advanced accumulation with nullvalues
In Particular I did this:
Load
CPeriod as CumPeriod,
AddMonths(CPeriod,1-IterNo()) as CPeriod
Resident ProdData
While IterNo()<=12;
On the Line chart, I change the Dimension from CPeriod to CumPeriod and the expresion become very simple:
(Sum(Service)+Sum(Spare)) * 1000 / sum(production).
Thanks again.