Unlock a world of possibilities! Login now and discover the exclusive benefits awaiting you.
- Qlik Community
- :
- All Forums
- :
- QlikView App Dev
- :
- Re: Data value in header label in a pivot table
- Subscribe to RSS Feed
- Mark Topic as New
- Mark Topic as Read
- Float this Topic for Current User
- Bookmark
- Subscribe
- Mute
- Printer Friendly Page
- Mark as New
- Bookmark
- Subscribe
- Mute
- Subscribe to RSS Feed
- Permalink
- Report Inappropriate Content
Data value in header label in a pivot table
hi qlikview people,
we have a pivot table, where we have countries and then on the sub level values in a common currency (e.g. EUR) and the local currency in the column beside it. Please see picture below:
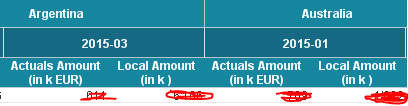
picture_1
In our data we have a column [County] and a column [Local_Currency]. Our goal is to have a dinamic label, to display the local currency value (e.g. Local amount (in k ARS) for Argentina, Local amount (in k USD) for USA, etc.). Please see picture below:
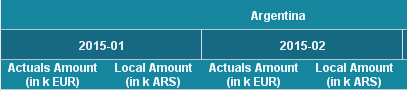
picture_2
If we put the expression label as ='Local Amount (in k '&[Local_currency]&')' , it only works, when we filter for only 1 country (from a list box, which includes Countries).
Hope I have described my issue and expected result well enough for you to understand.
Thanks for your help and suggestions in advance.
Best regards,
Fran
- Mark as New
- Bookmark
- Subscribe
- Mute
- Subscribe to RSS Feed
- Permalink
- Report Inappropriate Content
For the lables you can manually type the different currencies or use the below for each expression's label
Replace Country for different expressions.
='Local Amount (in k '& Concat({<Country = {'USA'}>} [Local_currency]) &')'
HTH
Best,
S
- Mark as New
- Bookmark
- Subscribe
- Mute
- Subscribe to RSS Feed
- Permalink
- Report Inappropriate Content
But this gives us only fixed Currency for USA: Concat({<Country = {'USA'}>} [Local_currency]).
Can we do something like Concat({<Country = {=Country}>} [Local_currency])
And show this in the header dynamically?
- Mark as New
- Bookmark
- Subscribe
- Mute
- Subscribe to RSS Feed
- Permalink
- Report Inappropriate Content
Hi
I think that the calculation of the label expression happens once for the chart/table and is not sensitive to the position in the chart. It works when one country is selected as the expression then works as there is only one possible value when it is evaluated.
To the best of my knowledge, there is no simple and effective workaround. You can mess around with overlaid text boxes or complex chart expressions and structures along with custom formatting that fake the header on the total lines.
HTH
Jonathan
- Mark as New
- Bookmark
- Subscribe
- Mute
- Subscribe to RSS Feed
- Permalink
- Report Inappropriate Content
You will need individual expressions for each of the currency, that is why I mentioned you can essentially type the Currency manually without using the formula. I don't know of any dynamic way to do what you want to do.
Only other thing I might explore is to probably use a pivot table with calculated dimension and try to use that to do what you are trying to achieve.
HTH
Best,
S
- Mark as New
- Bookmark
- Subscribe
- Mute
- Subscribe to RSS Feed
- Permalink
- Report Inappropriate Content
We thought of calculated dimensions as well, but unfortunately set analysis does not work on header level. Indeed, it looks like header is evaluated once per chart.
- Mark as New
- Bookmark
- Subscribe
- Mute
- Subscribe to RSS Feed
- Permalink
- Report Inappropriate Content
Sorry, I wish there was a better solution for what you wanted.
Best,
S