Unlock a world of possibilities! Login now and discover the exclusive benefits awaiting you.
- Qlik Community
- :
- All Forums
- :
- QlikView App Dev
- :
- Re: Using accumulation in expressions
- Subscribe to RSS Feed
- Mark Topic as New
- Mark Topic as Read
- Float this Topic for Current User
- Bookmark
- Subscribe
- Mute
- Printer Friendly Page
- Mark as New
- Bookmark
- Subscribe
- Mute
- Subscribe to RSS Feed
- Permalink
- Report Inappropriate Content
Using accumulation in expressions
I have got a list of items sold at a certain price and volume (#units), resulting in the corresponding revenue (price * units, see e.g. first table).
Now I would like to calculate the price level where the accumulated revenue (running total) is at least 20% of the total revenue. (which is “price = 9” in the example, see second table). I need this value for further visualizations.
At the moment I am struggling to calculate the accumulated revenue and use it inside an expression (formula).


Accepted Solutions
- Mark as New
- Bookmark
- Subscribe
- Mute
- Subscribe to RSS Feed
- Permalink
- Report Inappropriate Content
This is a tricky one ...
You need a new field in the data model that lists all distinct values of prices SORTED!
LOAD DISTINCT
Price, Price AS PriceSorted
RESIDENT data
ORDER BY Price;

Then you can use the following set-modifier to refer to the middle cumulated 60% (>=20%, <=80%) according to revenue (Price * Units):
<PriceSorted = {
"=Aggr( RangeSum(Sum(Units * Price) / Sum(TOTAL Units * Price), Above(Column(1))) ,PriceSorted) > 0.2
AND Aggr( RangeSum(Sum(Units * Price) / Sum(TOTAL Units * Price), Above(Column(1))) ,PriceSorted) < 0.8"
}>
Ideally, save this into a variable and refer to it wherever needed:
- In a grand total in a text box
- Select the middle 60% prices
- Name the upper / lower prices within that middle 60% range
(No need for macro, no need for alternate state, always recalculating relative to your selection.)
See attached file

- Mark as New
- Bookmark
- Subscribe
- Mute
- Subscribe to RSS Feed
- Permalink
- Report Inappropriate Content
Somehow I am unable to understand the link between your first table and your second table. Item 1 priced 10 and 18 units are sold. But in your second table you are showing Sum(Revenue) = 9? Can you help me understand what is the link between the above two tables?
Best,
S
- Mark as New
- Bookmark
- Subscribe
- Mute
- Subscribe to RSS Feed
- Permalink
- Report Inappropriate Content
Table 2 shows the revenue generated with all items at a certain price level, e.g. for price = 1 we have revenue = 9 (item15), for price = 6 we have revnue = 48 + 18 + 114 = 180 (item4 + item6 + item17). Price is taken as a dimension in that case.
- Mark as New
- Bookmark
- Subscribe
- Mute
- Subscribe to RSS Feed
- Permalink
- Report Inappropriate Content
This is a tricky one ...
You need a new field in the data model that lists all distinct values of prices SORTED!
LOAD DISTINCT
Price, Price AS PriceSorted
RESIDENT data
ORDER BY Price;
Then you can use the following set-modifier to refer to the middle cumulated 60% (>=20%, <=80%) according to revenue (Price * Units):
<PriceSorted = {
"=Aggr( RangeSum(Sum(Units * Price) / Sum(TOTAL Units * Price), Above(Column(1))) ,PriceSorted) > 0.2
AND Aggr( RangeSum(Sum(Units * Price) / Sum(TOTAL Units * Price), Above(Column(1))) ,PriceSorted) < 0.8"
}>
Ideally, save this into a variable and refer to it wherever needed:
- In a grand total in a text box
- Select the middle 60% prices
- Name the upper / lower prices within that middle 60% range
(No need for macro, no need for alternate state, always recalculating relative to your selection.)
See attached file
- Mark as New
- Bookmark
- Subscribe
- Mute
- Subscribe to RSS Feed
- Permalink
- Report Inappropriate Content
Thanks again for your effort and the solution! Good to see that inter-record functions also work inside AGGR.
- Mark as New
- Bookmark
- Subscribe
- Mute
- Subscribe to RSS Feed
- Permalink
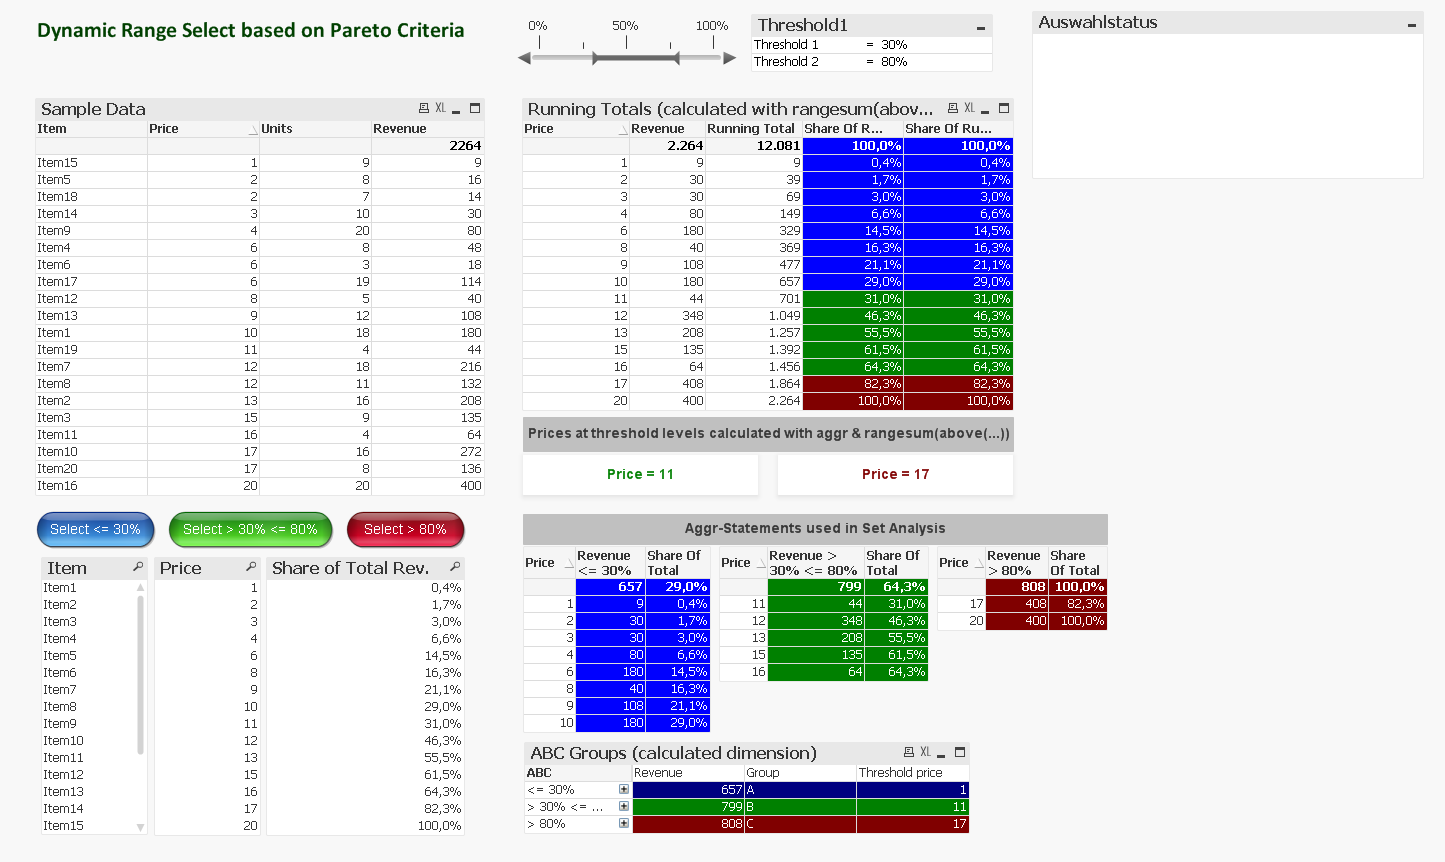
- Report Inappropriate Content
Here's my example app where I combined the solution concepts mentioned above into a single app with dynamic thresholds (configurable via slider and input box) including a calculated dimension to reflect the price groups (similar to ABC / Pareto analyses). !