Unlock a world of possibilities! Login now and discover the exclusive benefits awaiting you.
- Qlik Community
- :
- Forums
- :
- Analytics
- :
- New to Qlik Analytics
- :
- Re: how to set sequential color of a bar chart in ...
- Subscribe to RSS Feed
- Mark Topic as New
- Mark Topic as Read
- Float this Topic for Current User
- Bookmark
- Subscribe
- Mute
- Printer Friendly Page
- Mark as New
- Bookmark
- Subscribe
- Mute
- Subscribe to RSS Feed
- Permalink
- Report Inappropriate Content
how to set sequential color of a bar chart in Qlik Sense?
Hello all,
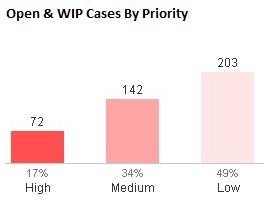
This is Qlik Sense app related. Does anyone know how can i achieve this kind of sequential color in Qlik Sense?
- Mark as New
- Bookmark
- Subscribe
- Mute
- Subscribe to RSS Feed
- Permalink
- Report Inappropriate Content
Hi,
For this you have to select the Colors by Measure for the settings
1. Appearances >> Colors And Legend.
2. Then select the By Measure.
3. Select the Sequential Classes (It depends on your requirement)
Regards
Anand
- Mark as New
- Bookmark
- Subscribe
- Mute
- Subscribe to RSS Feed
- Permalink
- Report Inappropriate Content
i have selected Sequential Classes , but i want it to be in red color. cant change.
- Mark as New
- Bookmark
- Subscribe
- Mute
- Subscribe to RSS Feed
- Permalink
- Report Inappropriate Content
Hi Fuan,
Currently you can't change the colors used, instead you can use the color by expression and a colormix function to create a gradient.
In this example
Measure: sum([Budget Amount])
Dimension: [Sales Rep Name]
Colormix1((sum([Budget Amount])-$(=min(aggr( sum([Budget Amount]), [Sales Rep Name]))))/$(=(max(aggr( sum([Budget Amount]), [Sales Rep Name]))-min(aggr( sum([Budget Amount]), [Sales Rep Name])))),Red(),Lightred())
Regards,
Patrik