Unlock a world of possibilities! Login now and discover the exclusive benefits awaiting you.
- Qlik Community
- :
- Forums
- :
- Analytics
- :
- New to Qlik Analytics
- :
- Re: Help with using expressions to find data patte...
- Subscribe to RSS Feed
- Mark Topic as New
- Mark Topic as Read
- Float this Topic for Current User
- Bookmark
- Subscribe
- Mute
- Printer Friendly Page
- Mark as New
- Bookmark
- Subscribe
- Mute
- Subscribe to RSS Feed
- Permalink
- Report Inappropriate Content
Help with using expressions to find data patterns and display them
I am trying to figure out how to write a few expressions such as the following. Can anyone help? Please and thank you, I'm at my wit's end.
VAR1 = Ice Cream Flavors
VAR 2 = Ice Cream Shop Locations
How do I display a list of all of the VAR1s that are at more than 1 VAR2?
How do I select a VAR1 and show on a map which VAR2s it is located at?
How do I choose a VAR2 and show me all of the other VAR2s that have the same VAR1s?
Your help is greatly greatly appreciated!
- Mark as New
- Bookmark
- Subscribe
- Mute
- Subscribe to RSS Feed
- Permalink
- Report Inappropriate Content
Hello Drew - before I or another community member responds with some suggestions, I'd like to gather more information. Are you new to Qlik products and the way that data is associated automatically when loaded into our Qlik engine? Are you using Qlik Sense or QlikView?
The reason I ask is that, your questions seem a bit familiar to me. I too - when once used traditional BI solutions, thought I had to do things a specific way, based off the way I did them with SQL query tools and traditional BI approaches.
If you have a few mins - check out the information and video found here and let us know if this is helpful. Once we have a better understanding of what you are trying to do - we can better assist you and provide some samples to help you along.
Qlik Sense - Selections that make "Sense"
Regards,
Mike Tarallo
Qlik
Mike Tarallo
Qlik
- Mark as New
- Bookmark
- Subscribe
- Mute
- Subscribe to RSS Feed
- Permalink
- Report Inappropriate Content
I'm using Qlik Sense and yes, I am new to Qlik products. Regardless of the way that the data is associated, I need to be able to display trends, and I am hoping this product can do it for me. Thanks!
- Mark as New
- Bookmark
- Subscribe
- Mute
- Subscribe to RSS Feed
- Permalink
- Report Inappropriate Content
Great Drew -
How do I select a VAR1 and show on a map which VAR2s it is located at?
This would require VAR1 to be a field / dimension in a list box for example - the data model would have this dimension associated with another dimension (VAR 2) - on some key. The other dimensions in the model - Latitude and Longitude would be used to generate a point for a point map - you can see this video here:
Using the Maps Chart Object - Points Maps - Part 1 - (video)
How do I choose a VAR2 and show me all of the other VAR2s that have the same VAR1s?
This can be done a few ways, it depends on how you want to display the data. This can be done with the list box and the colors, green white and grey - hence the video I sent you.
So based on your data model - these associations would/should occur automatically.
How do I display a list of all of the VAR1s that are at more than 1 VAR2?
Let's see if the attached example is closer to what you are looking for. Note I created some inline sample data to represent your VARs.
Copy the .qvf file to your C:\Users\<user profile>\Documents\Qlik\Sense\Apps directory and refresh (F5) Qlik Sense Desktop.
Please mark the appropriate replies as CORRECT / HELPFUL so our team and other members know that your question(s) has been answered to your satisfaction.
Regards,
Mike Tarallo
Qlik
For example:
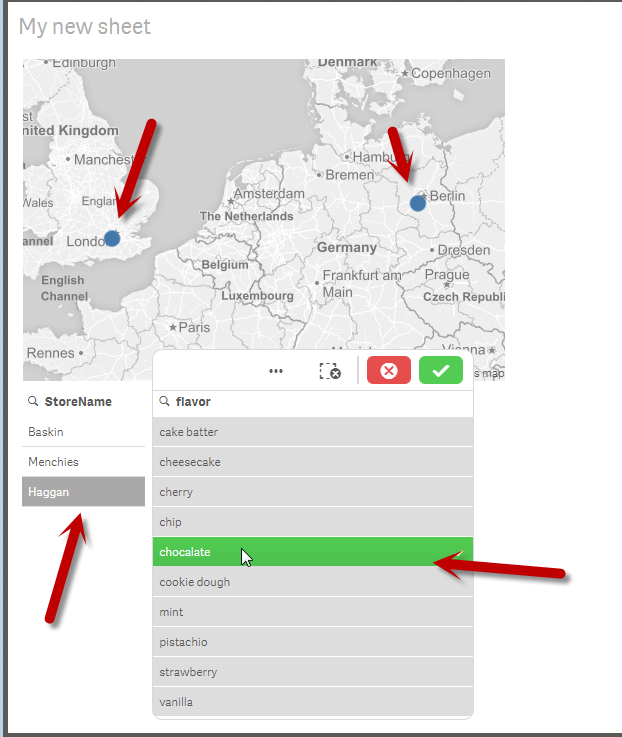
Selecting chocalate - which I spelled wrong (LOL) - shows that it is available in Baskin and Menchies but not in Haggan, It also shows the location as to where chocolate is being sold. This is due to the associations in the data model.
Mike Tarallo
Qlik
- Mark as New
- Bookmark
- Subscribe
- Mute
- Subscribe to RSS Feed
- Permalink
- Report Inappropriate Content
OK, so my question now becomes,
If I select 2 (or more) stores, I want to show
-a KPI that gives me the number of unique flavors between each store
-a list of the flavors that are unique
- Mark as New
- Bookmark
- Subscribe
- Mute
- Subscribe to RSS Feed
- Permalink
- Report Inappropriate Content
Hello Drew - check the attached QVF file - I believe we are closer, or have what you want.
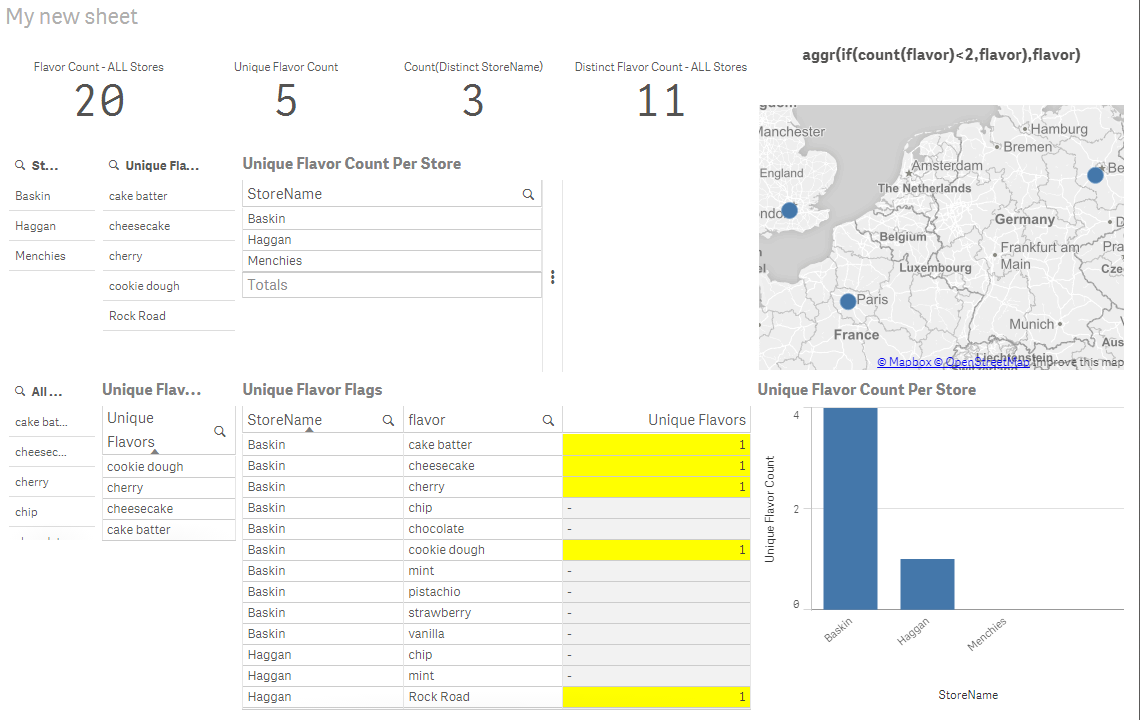
Qlik Sense by default will perform a full outer join when associating data -this will not give us the results we are looking for. In order to do what you are looking for, we must do an explicit inner join (at least based on the sample model I created) - see the script:
In an INNER join, only records with a match across both tables will be kept. That way we can calculate the unique records using a few chart functions as I described below.
The other pieces to this - is to use the aggr(), count() and If conditional functions to find the unique flavors as in:
aggr(if(count(flavor)<2,1),flavor) - you can learn more here and here
flavors:

LOAD * INLINE [

flavor_key,flavor
1,vanilla
2,chocolate
3,strawberry
4,chip
5,mint
6,pistachio
7,cookie dough
8,cherry
9,cheesecake
10,cake batter
11,Rock Road
];

location:

INNER JOIN (flavors)
LOAD * INLINE [

store_key,flavor_key,StoreName
1,1,Menchies
1,2,Menchies
1,3,Menchies
1,4,Menchies
1,5,Menchies
1,6,Menchies
2,1,Baskin
2,2,Baskin
2,3,Baskin
2,4,Baskin
2,5,Baskin
2,6,Baskin
2,7,Baskin
2,8,Baskin
2,9,Baskin
2,10,Baskin
3,3,Haggan
3,4,Haggan
3,5,Haggan
3,11,Haggan

];

coordinates:

Load * INLINE [

store_key,lat,long
1,52.3396296,13.0911663
2,51.3849401,-0.3514683
3,48.815573,2.224199

];

Final:

Load *, GeoMakePoint(lat,long) as Location_key
Resident coordinates;

Drop Table coordinates;
HTH
Please mark the appropriate replies as CORRECT / HELPFUL so our team and other members know that your question(s) has been answered to your satisfaction.
Regards,
Mike Tarallo
Qlik
Mike Tarallo
Qlik
- Mark as New
- Bookmark
- Subscribe
- Mute
- Subscribe to RSS Feed
- Permalink
- Report Inappropriate Content
This is very helpful, however the difference is that I am not loading the Flavors and Locations separately, they are both in one csv. Is there a way I can directly send you what I am working on? The content is sensitive. I will be more than happy to post the resolution, I just don't want the data out there in the open 
- Mark as New
- Bookmark
- Subscribe
- Mute
- Subscribe to RSS Feed
- Permalink
- Report Inappropriate Content
Hi Drew - let me check with our team - I want to make sure we are doing the right thing that protects you and us.
Someone from the pre-sales org may contact you to verify.
Regards,
Mike T
Qlik
Mike Tarallo
Qlik