Unlock a world of possibilities! Login now and discover the exclusive benefits awaiting you.
- Qlik Community
- :
- Forums
- :
- Analytics
- :
- New to Qlik Analytics
- :
- Re: How to filter a table by a measure
- Subscribe to RSS Feed
- Mark Topic as New
- Mark Topic as Read
- Float this Topic for Current User
- Bookmark
- Subscribe
- Mute
- Printer Friendly Page
- Mark as New
- Bookmark
- Subscribe
- Mute
- Subscribe to RSS Feed
- Permalink
- Report Inappropriate Content
How to filter a table by a measure
Hey there,
I have a table with various dimensions and one measure.
Now, I always(pre-selected) want to display data were the measure has the value 1.
But how can I filter it?
Anyone can help me?
- « Previous Replies
- Next Replies »
Accepted Solutions
- Mark as New
- Bookmark
- Subscribe
- Mute
- Subscribe to RSS Feed
- Permalink
- Report Inappropriate Content
Thanks so much
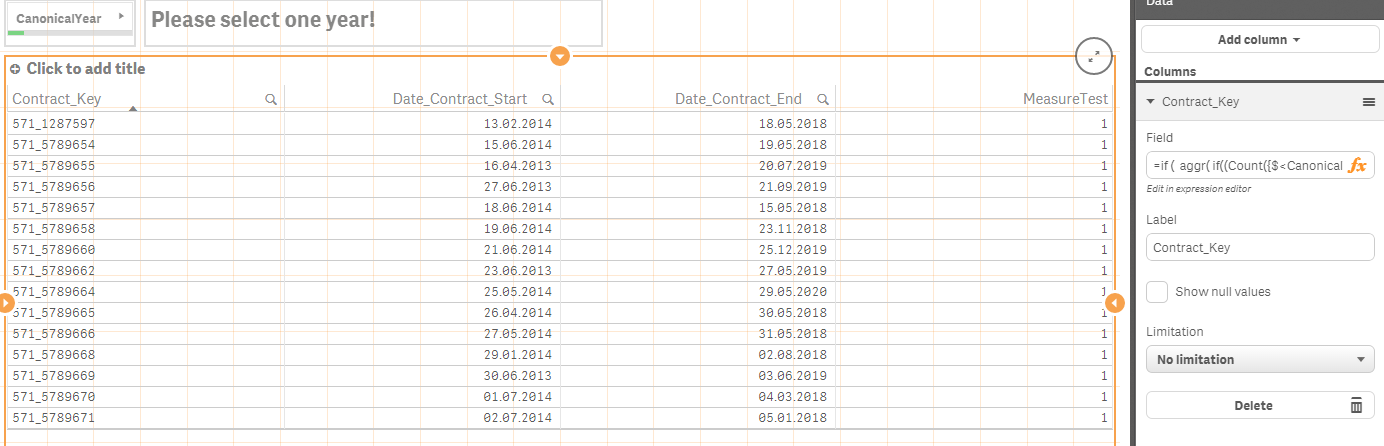
Here is the App with the approach in place:
The new dimension is as follows:
if (
aggr(
if(
(Count({$<CanonicalYear = {"<$(=(CanonicalYear))"}, CanonicalMonth = ,
DateType = {'Contract_Start'}>}DISTINCT(Contract_Key))
+
Count({$<CanonicalYear = {"=$(=(CanonicalYear))"}, CanonicalMonth = {"<=$(=MAX(CanonicalMonth))"},
DateType = {'Contract_Start'}>}DISTINCT(Contract_Key))
-
Count({$<CanonicalYear = {"<$(=(CanonicalYear))"}, CanonicalMonth = ,
DateType = {'Contract_End'}>}DISTINCT(Contract_Key))
-
Count({$<CanonicalYear = {"=$(=(CanonicalYear))"}, CanonicalMonth = {"<=$(=MAX(CanonicalMonth))"},
DateType = {'Contract_End'}>}DISTINCT(Contract_Key))) = 1, 1, 0)
,Contract_Key)=1 ,
Contract_Key)
- Mark as New
- Bookmark
- Subscribe
- Mute
- Subscribe to RSS Feed
- Permalink
- Report Inappropriate Content
Go to settings
Document properties
OnOpen Event
Trigger Select to Select IN FIELD
FIELD
measure
Search String
=1
- Mark as New
- Bookmark
- Subscribe
- Mute
- Subscribe to RSS Feed
- Permalink
- Report Inappropriate Content
I'm talking about Qlik Sense, not QlikView 
I don't think that Triggers are possible in Sense?!
- Mark as New
- Bookmark
- Subscribe
- Mute
- Subscribe to RSS Feed
- Permalink
- Report Inappropriate Content
apologize !
- Mark as New
- Bookmark
- Subscribe
- Mute
- Subscribe to RSS Feed
- Permalink
- Report Inappropriate Content
Couple ways:
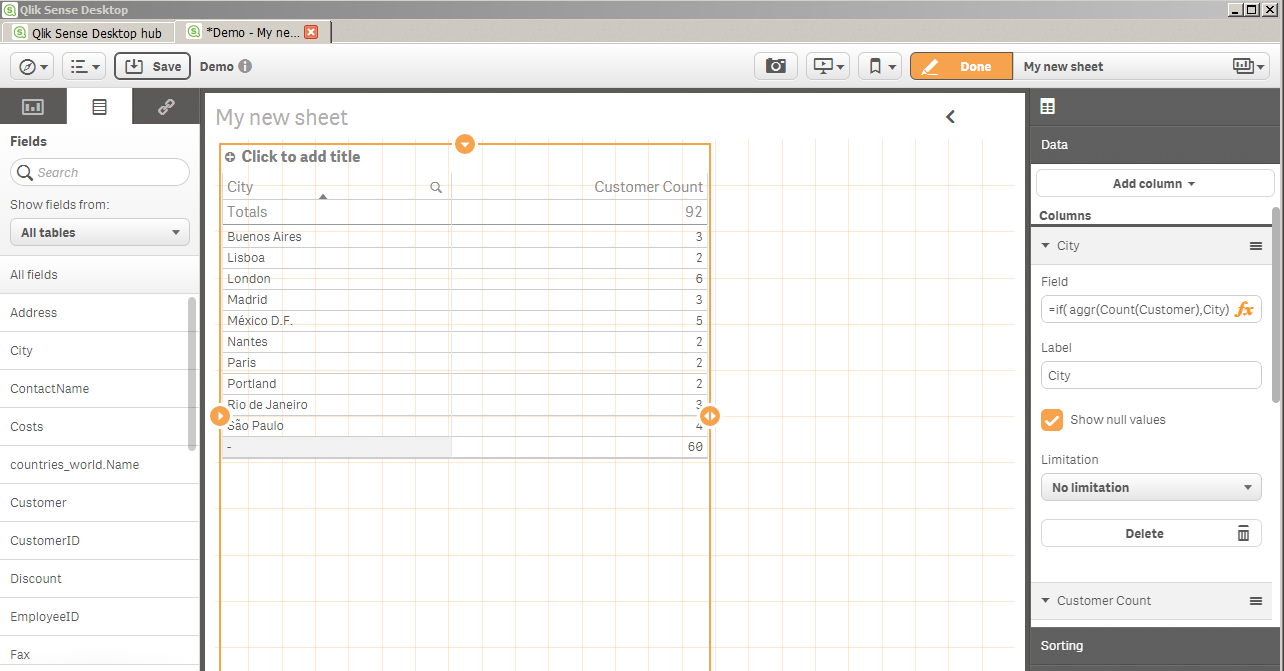
1. Change the dimension to be conditionally NULL if the measure<>1 , and then unselect 'show nulls'
So if the table had one Dimension (City) and the measure was count(customer) , you could change the dimension to conditionally show city depending on whether the count of customers aggregated by city was = 1 (or <>1 etc..)
=if( aggr(Count(Customer),City)=1, City)
2. Or use set analysis in the measure to filter for a set where the measure value =1
Same example, leave the dimension as is (City) , and put in a set analysis modifier to filter for cities where count(Customer)=1. Exact syntax is very important. And think about the right aggregation context... you may need to use a unique row identifier in lieu of just 'city' if you have multiple dimensions
Count ( {<City={"=count(Customer)=1"}>} Customer)
- Mark as New
- Bookmark
- Subscribe
- Mute
- Subscribe to RSS Feed
- Permalink
- Report Inappropriate Content
Thanks for your input.
Actually I think it's a little bit more complicated, at least for me 
I have 11 dimensions and one measure in my table.
The measure is calculated this way:
Count({$<MasterYear = {"<$(=(MasterYear))"},
MasterMonth = ,
Relevant_Sales = {1},
Contract_Status_Code -= {0},
Contract_Status_Code -= {10},
DateType = {'Contract_Start'}>}DISTINCT(Contract_Key))
+
Count({$<MasterYear = {"=$(=(MasterYear))"},
MasterMonth = {"<=$(=MAX(MasterMonth))"},
Relevant_Sales = {1},
Contract_Status_Code -= {0},
Contract_Status_Code -= {10},
DateType = {'Contract_Start'}>}DISTINCT(Contract_Key))
-
Count({$<MasterYear = {"<$(=(MasterYear))"},
Relevant_Sales = {1},
MasterMonth = ,
Contract_Status_Code -= {0},
Contract_Status_Code -= {10},
DateType = {'Contract_End_Real'}>}DISTINCT(Contract_Key))
-
Count({$<MasterYear = {"=$(=(MasterYear))"},
Relevant_Sales = {1},
MasterMonth = {"<=$(=MAX(MasterMonth))"},
Contract_Status_Code -= {0},
Contract_Status_Code -= {10},
DateType = {'Contract_End_Real'}>}DISTINCT(Contract_Key))
It calculates the portfolio for a specific year/month. The actual result of this calculation is about a few hundreds or thousands.
Now I want to display all contracts(records) in this table which are in my portfolio.
When I use my 11 dimensions and the portfolio measure as measure in the table, I get all contracts(records).
The portfolio column has two values:
0 for records that are not in the actual portfolio calculation.
1 for records that are in the actual portfolio calculation.
Logically, I want only these records with portfolio = 1 
Your hint is a first step but I dont get it....
- Mark as New
- Bookmark
- Subscribe
- Mute
- Subscribe to RSS Feed
- Permalink
- Report Inappropriate Content
Going with option #2 seems tricky for this kind of measure.
Option #1 might be easier. might
Do any of these 11 dimensions in the table create a unique identifier value for each row ?
If yes, you can use option #1 , but you need to reference each of the 11 dimensions as a comma delimitted list for the 2nd argument of the aggr() function. Something like the following except that instead of Count(Customer) you copy/paste in your large measure expression for the 1st argument.
=if( aggr(Count(Customer),Dimension1,Dimension2,Dimension3,.....,Dimension11)=1, UniqueIdentifierDimension)
If no, things get tricky depending on the data model.
it may be relatively easy or relatively hard to create a unique identifier dimension in the load editor using the autonumber function:
NewTable:
Load
*,
autonumber(Dimension1&Dimension2&Dimension3& ... &Dimension11,'UniqueIdentifier') as UniqueIdentifier
from <datasource>;
This creates a unique integer value for each combination of the 11 dimensions creating a new unique identifier for each row in the table you are putting together. Once this id done add this new unique identifier into the table and modify the expression to follow option #1:
=if( aggr(Count(Customer),UniqueIdentifier)
The exact load script would need to be worked out depending on your data model and may even require some reorganization of the data model unfortunately.
Sorry this isn't much easier and feel free to share your QVF if you like for additional help.
- Mark as New
- Bookmark
- Subscribe
- Mute
- Subscribe to RSS Feed
- Permalink
- Report Inappropriate Content
Thanks again 
The Contract_Key dimension is definitly unique.
My custom dimension:
if( aggr(
(Count({$<CanonicalYear = {"<$(=(CanonicalYear))"},
CanonicalMonth = ,
DateType = {'Contract_Start'}>}DISTINCT(Contract_Key))
+
Count({$<CanonicalYear = {"=$(=(CanonicalYear))"},
CanonicalMonth = {"<=$(=MAX(CanonicalMonth))"},
DateType = {'Contract_Start'}>}DISTINCT(Contract_Key))
-
Count({$<CanonicalYear = {"<$(=(CanonicalYear))"},
CanonicalMonth = ,
DateType = {'Contract_End'}>}DISTINCT(Contract_Key))
-
Count({$<CanonicalYear = {"=$(=(CanonicalYear))"},
CanonicalMonth = {"<=$(=MAX(CanonicalMonth))"},
DateType = {'Contract_End'}>}DISTINCT(Contract_Key)))
,Country, Contract_No)=1, Contract_Key)
The result oft that:
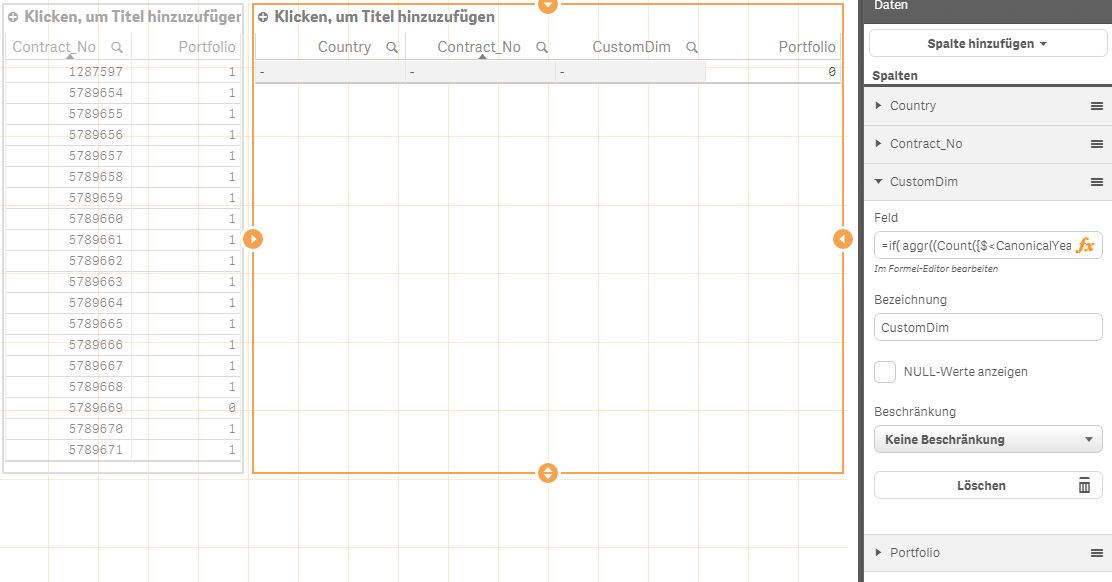
On the left you cann see the different Contract_No and the value of the measure with 0 or 1. On the right my first tests with your suggestion.
How you can see... it does not work very well
Do not get confused, the data here has only sample data with fewer dimensions/columns.
The table object on the left is a good example:
All but one record are in the actual portfolio. (portfolio = 1). Only the thrid from button has the value 0. This record should not be displayed in the table.
Is there anything that I'm doing wrong?
Thank you very much for your help!
- Mark as New
- Bookmark
- Subscribe
- Mute
- Subscribe to RSS Feed
- Permalink
- Report Inappropriate Content
Ok...
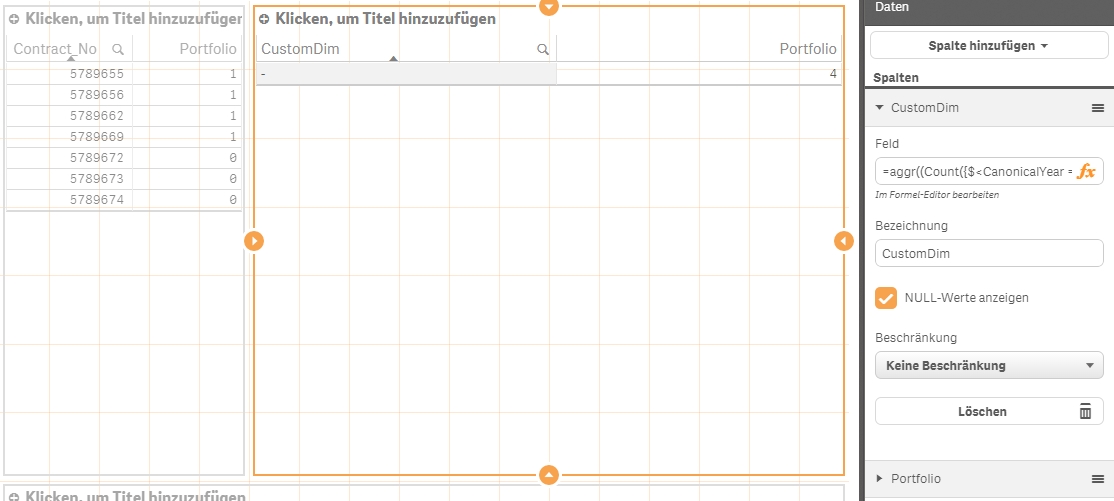
First lets try to just add the aggr() expression as a new Dimension in the table. Can you copy/paste the expression below ? It aggregates your expression by Contract_key.
See if the table returns rows..
aggr(
(
Count({$<CanonicalYear = {"<$(=(CanonicalYear))"}, CanonicalMonth = , DateType = {'Contract_Start'}>}DISTINCT(Contract_Key))
+
Count({$<CanonicalYear = {"=$(=(CanonicalYear))"}, CanonicalMonth = {"<=$(=MAX(CanonicalMonth))"},DateType = {'Contract_Start'}>}DISTINCT(Contract_Key))
-
Count({$<CanonicalYear = {"<$(=(CanonicalYear))"}, CanonicalMonth = , DateType = {'Contract_End'}>}DISTINCT(Contract_Key))
-
Count({$<CanonicalYear = {"=$(=(CanonicalYear))"}, CanonicalMonth = {"<=$(=MAX(CanonicalMonth))"}, DateType = {'Contract_End'}>}DISTINCT(Contract_Key))
)
,
Contract_Key)
- Mark as New
- Bookmark
- Subscribe
- Mute
- Subscribe to RSS Feed
- Permalink
- Report Inappropriate Content
Thats my expression for the CustomDim:
aggr(
(Count({$<CanonicalYear = {"<$(=(CanonicalYear))"}
, CanonicalMonth =
, DateType = {'Contract_Start'}>}DISTINCT(Contract_Key))
+
Count({$<CanonicalYear = {"=$(=(CanonicalYear))"}
, CanonicalMonth = {"<=$(=MAX(CanonicalMonth))"}
,DateType = {'Contract_Start'}>}DISTINCT(Contract_Key))
-
Count({$<CanonicalYear = {"<$(=(CanonicalYear))"}
, CanonicalMonth =
, DateType = {'Contract_End'}>}DISTINCT(Contract_Key))
-
Count({$<CanonicalYear = {"=$(=(CanonicalYear))"}
, CanonicalMonth = {"<=$(=MAX(CanonicalMonth))"}
, DateType = {'Contract_End'}>}DISTINCT(Contract_Key))
),Contract_Key)
Here is the source file:
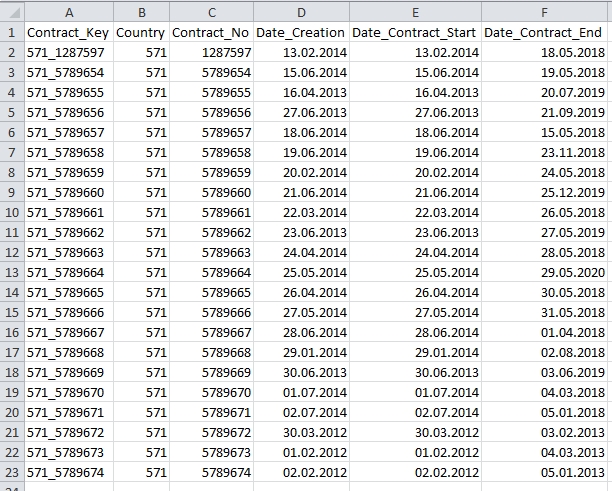
In the first screenshot year = 2013 is selected. So we have 4 Contracts which are active in the whole year 2013.
- « Previous Replies
- Next Replies »