Unlock a world of possibilities! Login now and discover the exclusive benefits awaiting you.
- Qlik Community
- :
- All Forums
- :
- QlikView App Dev
- :
- Re: How to create this pivot ?
- Subscribe to RSS Feed
- Mark Topic as New
- Mark Topic as Read
- Float this Topic for Current User
- Bookmark
- Subscribe
- Mute
- Printer Friendly Page
- Mark as New
- Bookmark
- Subscribe
- Mute
- Subscribe to RSS Feed
- Permalink
- Report Inappropriate Content
How to create this pivot ?
Hello,
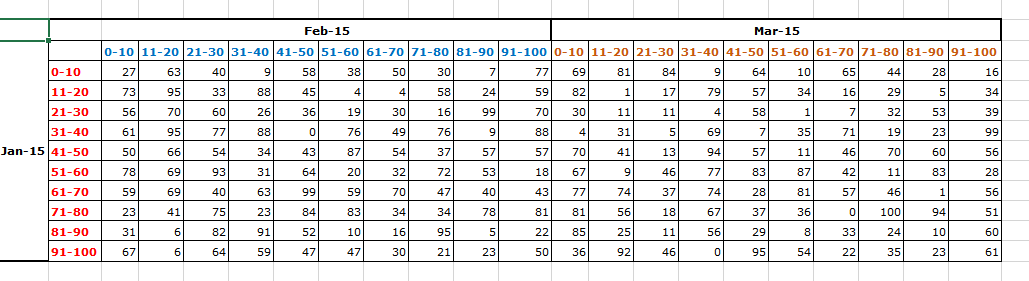
I am trying to create the following pivot
Basically, there is a period selector which is used to Select Jan - 15, and the bands on the left (in red) are the aging bands.
I want to represent that there are 73 people who were in the band 11 - 20 in jan-15 moved to 0 - 10 in Feb-15 and 82 in 0 - 10 in mar - 15
I am trying to show if there is a pattern in movement between bands across periods
Is this even possible ?
Please advise.
Thanks
- Mark as New
- Bookmark
- Subscribe
- Mute
- Subscribe to RSS Feed
- Permalink
- Report Inappropriate Content
Petter,
Yes you are right, the ultimate objective is to present this as a scatter chart - but unfortunately I cant even get the pivot to work 
- Mark as New
- Bookmark
- Subscribe
- Mute
- Subscribe to RSS Feed
- Permalink
- Report Inappropriate Content
In that case you can use a value list function for dimension. I think that will suit your needs perfectly. Get user input, create dimension values in a variable and use that within the value list function.
If you can give me a sample input to work with, I might be able to produce something for you. What I am unsure is how does SUB_ID gets linked to the user input? So a sample would be able to help here.
Best,
Sunny
- Mark as New
- Bookmark
- Subscribe
- Mute
- Subscribe to RSS Feed
- Permalink
- Report Inappropriate Content
Let me try and scramble data and send it - may take while
Meanwhile, ValueList cannot be used over an aggr function I suppose ?
My actual code to get the Buckets is below - v_mou_int is the user input variable
Aggr(Class(sum({Orig_Days),v_mou_int,'min'),month_year,CO_ID,Service)
- Mark as New
- Bookmark
- Subscribe
- Mute
- Subscribe to RSS Feed
- Permalink
- Report Inappropriate Content
I am thinking of using the Aggr in the variable which creates a static list of values for the ValueList function. I think what you are referring to is that Aggr (as an expression) doesn't work with the ValueList function which is definitely true.
HTH
Best,
Sunny
- Mark as New
- Bookmark
- Subscribe
- Mute
- Subscribe to RSS Feed
- Permalink
- Report Inappropriate Content
Take your time, I am in no hurry today 😉
- Mark as New
- Bookmark
- Subscribe
- Mute
- Subscribe to RSS Feed
- Permalink
- Report Inappropriate Content
Here is the sample data.
Basically, I have the table which I have chosen 1 sub Id and put them in different buckets in the various months.
So what I would like to achieve is what I described above.
I am going to try using the variable for aggr expression and use that in ValueList now..
- Mark as New
- Bookmark
- Subscribe
- Mute
- Subscribe to RSS Feed
- Permalink
- Report Inappropriate Content
I am going to try the same thing at my end... 
Best,
Sunny
- Mark as New
- Bookmark
- Subscribe
- Mute
- Subscribe to RSS Feed
- Permalink
- Report Inappropriate Content
Understanding the data would take some time, but I kind of understood what you wanted here. Not sure if you really need ValueList in your case. See if this new updated sample makes sense for you.
Best,
Sunny
- Mark as New
- Bookmark
- Subscribe
- Mute
- Subscribe to RSS Feed
- Permalink
- Report Inappropriate Content
I understand the way to create the dynamic buckets by creating two dimensions - but the month still seems to elude me
How about I create two list boxes with alternate states and use them ?
EDIT: Just realized you have already done this
- Mark as New
- Bookmark
- Subscribe
- Mute
- Subscribe to RSS Feed
- Permalink
- Report Inappropriate Content
So have we reached the final answer yet??? Not sure if we have or do we still need to work on it
Best,
Sunny