Unlock a world of possibilities! Login now and discover the exclusive benefits awaiting you.
- Qlik Community
- :
- All Forums
- :
- QlikView App Dev
- :
- Re: How to create this pivot ?
- Subscribe to RSS Feed
- Mark Topic as New
- Mark Topic as Read
- Float this Topic for Current User
- Bookmark
- Subscribe
- Mute
- Printer Friendly Page
- Mark as New
- Bookmark
- Subscribe
- Mute
- Subscribe to RSS Feed
- Permalink
- Report Inappropriate Content
How to create this pivot ?
Hello,
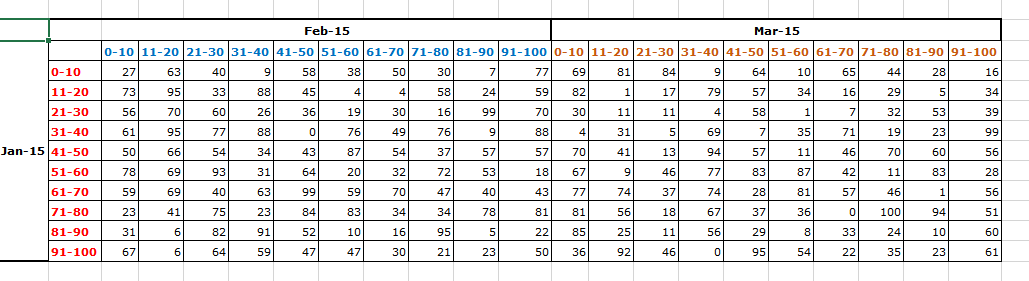
I am trying to create the following pivot
Basically, there is a period selector which is used to Select Jan - 15, and the bands on the left (in red) are the aging bands.
I want to represent that there are 73 people who were in the band 11 - 20 in jan-15 moved to 0 - 10 in Feb-15 and 82 in 0 - 10 in mar - 15
I am trying to show if there is a pattern in movement between bands across periods
Is this even possible ?
Please advise.
Thanks
- Mark as New
- Bookmark
- Subscribe
- Mute
- Subscribe to RSS Feed
- Permalink
- Report Inappropriate Content
Sunny - thanks to you - I think I almost got it - except for the first bill month which is chosen and the corresponding bucket.
In your example you still have BM and BC Month as two different dimensions. whereas that's not how I have it.
I have reattached my partially done solution - Don't know why the first dimension is not working.
- Mark as New
- Bookmark
- Subscribe
- Mute
- Subscribe to RSS Feed
- Permalink
- Report Inappropriate Content
Here you go, got it to work (PFA)
Thanks to Alternate state in calculated dimension - Set analysis
Best,
Sunny
- Mark as New
- Bookmark
- Subscribe
- Mute
- Subscribe to RSS Feed
- Permalink
- Report Inappropriate Content
Wonderful – you are truly a STAR !
Thelast glitch is the MoU band – I followed the way you have created $(vDim) for the MoU band as well– but look likes Only won’t work in this case coz I might have multiple MoU bands and I also use Aggr.
Thanks a lot for all the effort in solving my problem!
- Mark as New
- Bookmark
- Subscribe
- Mute
- Subscribe to RSS Feed
- Permalink
- Report Inappropriate Content
I am glad I was able to help. Btw I am Sun, not star 
Best,
Sunny
- Mark as New
- Bookmark
- Subscribe
- Mute
- Subscribe to RSS Feed
- Permalink
- Report Inappropriate Content
Sorry, I think I missed something, why do we need a dim for MoU Band? I thought it worked the way you wanted it to work? no?
Best,
Sunny
- Mark as New
- Bookmark
- Subscribe
- Mute
- Subscribe to RSS Feed
- Permalink
- Report Inappropriate Content
Well, I want to say someone who was in the 10 - 20 band for the chosen month (eg: 201501) moved to 30 - 40 in Feb 2015 and 20 - 30 in Marc 15.
So with the pivot, when someone chooses Jan 2015 as the anchor month, the anchor MoU would also be 10-20 to track from which band they have moved to which other band. Am I making sense ?
- Mark as New
- Bookmark
- Subscribe
- Mute
- Subscribe to RSS Feed
- Permalink
- Report Inappropriate Content
I think you are...  Let me see....
Best,
Sunny
- Mark as New
- Bookmark
- Subscribe
- Mute
- Subscribe to RSS Feed
- Permalink
- Report Inappropriate Content
Not sure if Class function can be used in alternate state, but I am sure there is a more laborious way to calculate ranges. I will continue to work on this, but may or may not get the result today itself.
Best,
Sunny
- Mark as New
- Bookmark
- Subscribe
- Mute
- Subscribe to RSS Feed
- Permalink
- Report Inappropriate Content
Interestingly
The following in a list box expression works - but doesn't in the pivot
Aggr(Class(sum({State1}MoU),v_mou_int,'MoU'),%CS_BC_MONTH,SUB_ID,SERVICE_NAME_ID)
I cant use Only as in the other blog post as I will have multiple values for bands
- Mark as New
- Bookmark
- Subscribe
- Mute
- Subscribe to RSS Feed
- Permalink
- Report Inappropriate Content
You know what, I think, you should close this thread and start new one for this issue. It would get greater exposure as lot of time people don't look at a post which already has 20-25 replies because they will need to go through each response to understand what has been done already (from my experience I do that, when I see a post with more than 5-8 replies I tend to not bother to look because I feel there are others who would handle the issue)
Related to the the use of alternate state, I don't think class function can directly be used, but we might be able to create ranges, but I have not yet tried that and will need to think about how we can do that.
Best,
Sunny