Unlock a world of possibilities! Login now and discover the exclusive benefits awaiting you.
- Qlik Community
- :
- Forums
- :
- Analytics
- :
- New to Qlik Analytics
- :
- Re: How to filter a table by a measure
- Subscribe to RSS Feed
- Mark Topic as New
- Mark Topic as Read
- Float this Topic for Current User
- Bookmark
- Subscribe
- Mute
- Printer Friendly Page
- Mark as New
- Bookmark
- Subscribe
- Mute
- Subscribe to RSS Feed
- Permalink
- Report Inappropriate Content
How to filter a table by a measure
Hey there,
I have a table with various dimensions and one measure.
Now, I always(pre-selected) want to display data were the measure has the value 1.
But how can I filter it?
Anyone can help me?
- Mark as New
- Bookmark
- Subscribe
- Mute
- Subscribe to RSS Feed
- Permalink
- Report Inappropriate Content
hmm... something is wrong. It gave you just a NULL for that calculated dimension. You should have had some numbers.
If you open up that calculated dimension in the f(x) expression editor, is Contract_Key (2nd argument of aggr()) colored in black ??
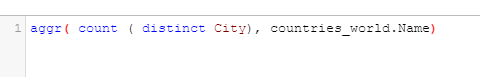
for example 'countries_world.Name' is a field, but qlik sense has colored it in black, which means it doesn't actually recognize it as a field name
if i put square brackets around that same text, qlik sense colors it in red, meaning that it knows its a field name
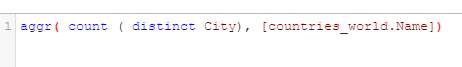
we need to make sure the expression is recognizing Contract_Key as a field . Try puting [] around it and retest.
- Mark as New
- Bookmark
- Subscribe
- Mute
- Subscribe to RSS Feed
- Permalink
- Report Inappropriate Content
Sorry for the late response, I was a few days out of the office due holidays here in Germany.
Contract_Key is colored in red.
Don't be confused... I tested it with our real project. Therefore the fields could be named a little bit different.
- Mark as New
- Bookmark
- Subscribe
- Mute
- Subscribe to RSS Feed
- Permalink
- Report Inappropriate Content
You could try wrapping your expression that calculates Portfolio in an IF() statement:
if(<your_expression> = 1, 1, 0)
It should then just display the rows where Portfolio returns 1
Thanks,
Azam
- Mark as New
- Bookmark
- Subscribe
- Mute
- Subscribe to RSS Feed
- Permalink
- Report Inappropriate Content
Thanks very much. Would be able to share the app ?
- Mark as New
- Bookmark
- Subscribe
- Mute
- Subscribe to RSS Feed
- Permalink
- Report Inappropriate Content
Hey,
When I use this as my measure (Portfolio), I get just the same like before. All columns and the measure as extra column with value 0 or 1....
if(
(Count({$<MasterYear = {"<$(=(MasterYear))"},
MasterMonth = ,
Relevant_Sales = {1},
Contract_Status_Code -= {0},
Contract_Status_Code -= {10},
DateType = {'Contract_Start'}>}DISTINCT(Contract_Key))
+
Count({<MasterYear = {$(=(MasterYear))},
MasterMonth = {"<=$(=MAX(MasterMonth))"},
Relevant_Sales = {1},
Contract_Status_Code -= {0},
Contract_Status_Code -= {10},
DateType = {'Contract_Start'}>}DISTINCT(Contract_Key))
-
Count({$<MasterYear = {"<$(=(MasterYear))"},
Relevant_Sales = {1},
MasterMonth = ,
Contract_Status_Code -= {0},
Contract_Status_Code -= {10},
DateType = {'Contract_End_Real'}>}DISTINCT(Contract_Key))
-
Count({<MasterYear = {$(=(MasterYear))},
Relevant_Sales = {1},
MasterMonth = {"<=$(=MAX(MasterMonth))"},
Contract_Status_Code -= {0},
Contract_Status_Code -= {10},
DateType = {'Contract_End_Real'}>}DISTINCT(Contract_Key))
) = 1,1, 0)
My complete procedure:
1. I'm adding a new measure with the code shown above. Thats my expression for the calculation of the portfolio. The normal return value is any number with the total amount of contracts.
2. I'm adding the new measure as measure in my table.
3. All rows are displayed, even the value of the measure is 0.
I don't know. Am I doing something wrong?
- Mark as New
- Bookmark
- Subscribe
- Mute
- Subscribe to RSS Feed
- Permalink
- Report Inappropriate Content
To be clear: It still doesn't work.
I only wanted to show you that the Contract_Key is recognized as field.
I will create a sample app that I can share with you.
- Mark as New
- Bookmark
- Subscribe
- Mute
- Subscribe to RSS Feed
- Permalink
- Report Inappropriate Content
Hi,
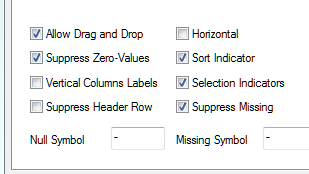
Thanks for challenging me on this. You know, it's something I stunbled on by "accident" a while ago whilst trying to solve a similar kind of problem and didn't really think about why it appears to work...in fact what really makes it work is having the "Supress Zero-Values" checked in Presentation. So in fact in this case, as you're already evaluating Profile to 0, or 1 the If() statement is not necessary. However, this is in QlikView and I'm not sure if the same feature is available in QlikSense...so sorry if I've wasted your time.
Azam
- Mark as New
- Bookmark
- Subscribe
- Mute
- Subscribe to RSS Feed
- Permalink
- Report Inappropriate Content
Don't worry!
Thanks for your input.
I'm afraid that there is only a possibility to suppress null values, not zeros.
Maybe that is one disadvantage of Sense. You don't have the same possibilities to adjust your objects.
But thats okay anyway. Both programs are for different purposes.
The challenge is to find a workaround 
- Mark as New
- Bookmark
- Subscribe
- Mute
- Subscribe to RSS Feed
- Permalink
- Report Inappropriate Content
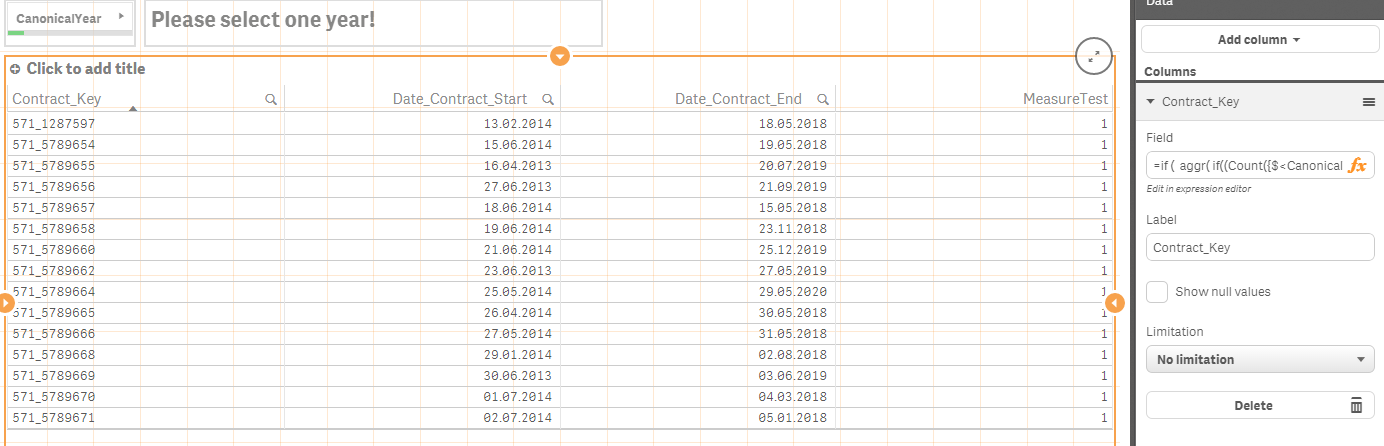
Finally, here is a sample app where you can test it yourself.
On the second worksheet ("Portfolio table") you have to select one year on the top of the sheet. (I suggest 2014)
After that, you can see all rows with "MeasureTest" as last column with values {1} and {0}.
The result of the portfolio calculation ist in this case very simple:
- The contract has a start date before or equal 2014.
- The contract has an end date > 2014.
Because of that, there a 7 contracts that have the value 0 because there aren't in the porftolio for 2014
So, actually the table should display only rows with MeasureTest's value is 1!
- Mark as New
- Bookmark
- Subscribe
- Mute
- Subscribe to RSS Feed
- Permalink
- Report Inappropriate Content
Thanks so much
Here is the App with the approach in place:
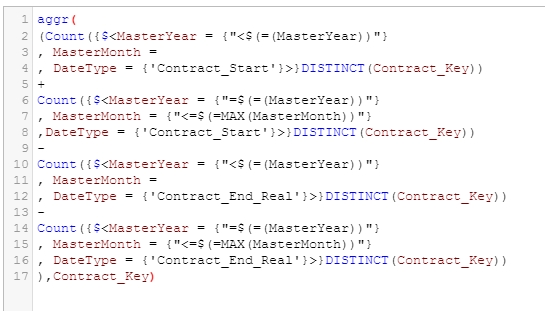
The new dimension is as follows:
if (
aggr(
if(
(Count({$<CanonicalYear = {"<$(=(CanonicalYear))"}, CanonicalMonth = ,
DateType = {'Contract_Start'}>}DISTINCT(Contract_Key))
+
Count({$<CanonicalYear = {"=$(=(CanonicalYear))"}, CanonicalMonth = {"<=$(=MAX(CanonicalMonth))"},
DateType = {'Contract_Start'}>}DISTINCT(Contract_Key))
-
Count({$<CanonicalYear = {"<$(=(CanonicalYear))"}, CanonicalMonth = ,
DateType = {'Contract_End'}>}DISTINCT(Contract_Key))
-
Count({$<CanonicalYear = {"=$(=(CanonicalYear))"}, CanonicalMonth = {"<=$(=MAX(CanonicalMonth))"},
DateType = {'Contract_End'}>}DISTINCT(Contract_Key))) = 1, 1, 0)
,Contract_Key)=1 ,
Contract_Key)