Unlock a world of possibilities! Login now and discover the exclusive benefits awaiting you.
- Qlik Community
- :
- Forums
- :
- Analytics
- :
- App Development
- :
- Qlik Sense does not sort "stacked" bar chart corre...
- Subscribe to RSS Feed
- Mark Topic as New
- Mark Topic as Read
- Float this Topic for Current User
- Bookmark
- Subscribe
- Mute
- Printer Friendly Page
- Mark as New
- Bookmark
- Subscribe
- Mute
- Subscribe to RSS Feed
- Permalink
- Report Inappropriate Content
Qlik Sense does not sort "stacked" bar chart correctly?!
I try to display active requisitions by recruiters and different steps of the recruiting process. I am using Qlik Sense desktop version 1.1.0+, build 31.QSMS10-CIGS. Here are my steps:
1. Add a bar chart.
2. Add "active requisition" measure.
3. Add "recruiter" dimension. The resulting dimension is enclosed below. So far, the chart is correct.
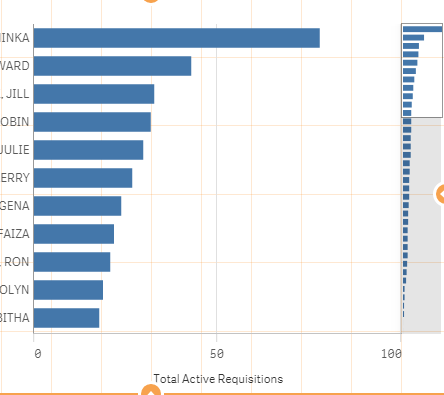
4. Now, I drag "step of candidate", click "add" to add it as the second dimension, and select "stacked bar chart" presentation. Here is the chart I got.
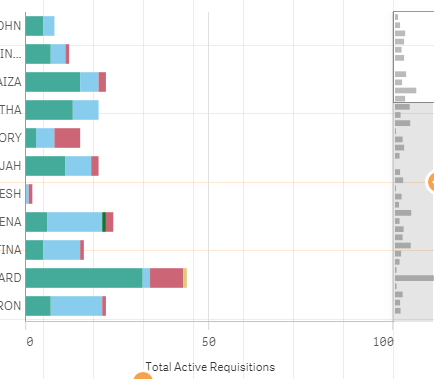
5. Here is the problem #1. If I try to drag "Total Active Requisitions" over or above "Recruiter", I cannot make "Total Active Requisitions" as priority 1 for sorting.
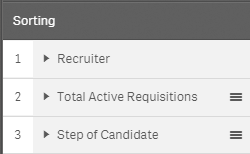
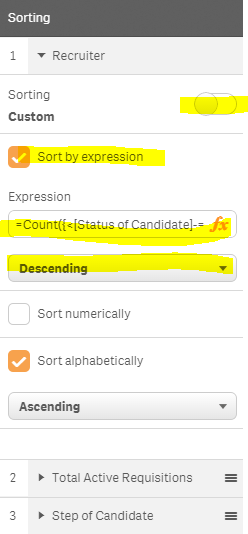
6. Problem #2: If I change "Recruiter" to custom sorting, and add the expression of "Total Active Requisitions" as a descending condition, the bar chart is still not sorted correctly. I expect the bar chart to be sorted in descending order of the total active requisitions by recruiters.
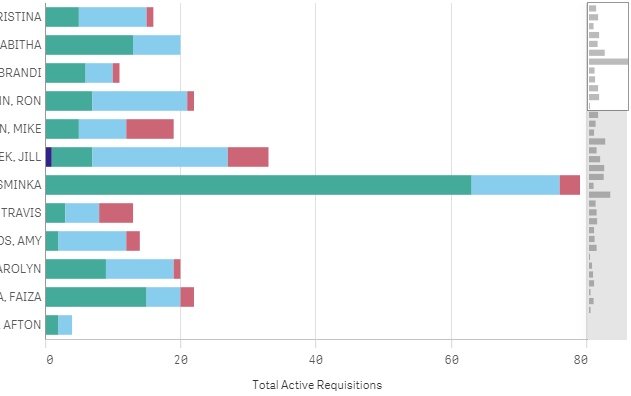
How do I make this work in Qlik Sense?
Accepted Solutions
- Mark as New
- Bookmark
- Subscribe
- Mute
- Subscribe to RSS Feed
- Permalink
- Report Inappropriate Content
I figure out the source of the problem. The measure of my chart is
Count(Distinct {<[Status of Candidate]-={'Completed'}>} Key_Requisition_Candidate)
The expression of my sort is
Count({<[Status of Candidate]-={'Completed'}>} Key_Requisition_Candidate)
This is why the sorting is not working as expected. I wish Qlik Sense has a way to drag my measure and drop to the sorting expression to avoid the problem. Because I have to type the sorting expression manually, I missed the "distinct" in my expression. So, Qlik Sense is working as expected.
Thank you all for your feedback.
- Mark as New
- Bookmark
- Subscribe
- Mute
- Subscribe to RSS Feed
- Permalink
- Report Inappropriate Content
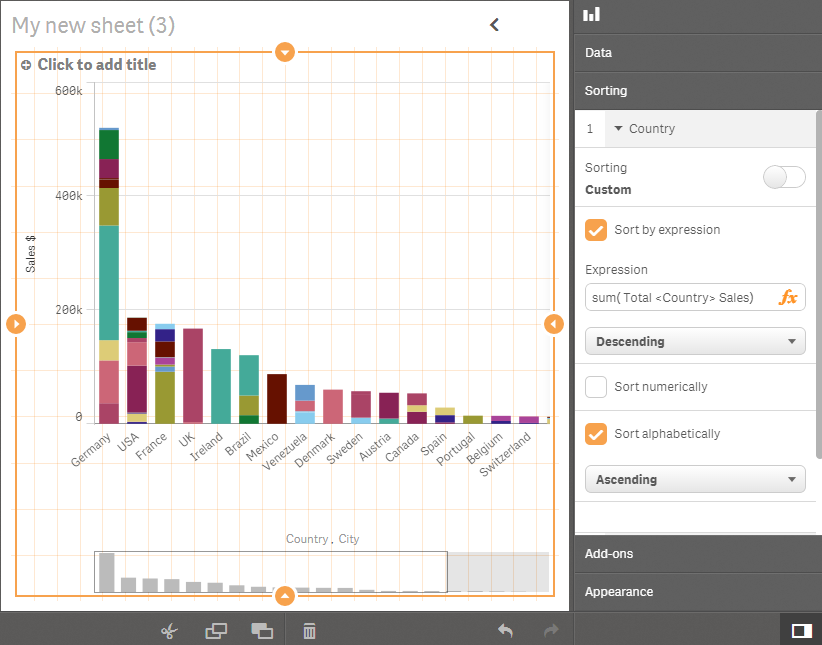
You need to switch the sorting of the first dimension from Auto to custom
Then select expression
And enter an expression that aggregates the measure by the 1st dimension
In the sample below:
Dim1: Country
Dim2: City
Measure: sum(Sales)
Sort expression for Dim1: sum( total <Country> Sales)
- Mark as New
- Bookmark
- Subscribe
- Mute
- Subscribe to RSS Feed
- Permalink
- Report Inappropriate Content
I try something similar to yours. In my data, "Distinct" would be more appropriate than "Total". Besides, I need the chart to work with other filters selected, not ignoring them, so I cannot use "Total".
It temporarily solves the problem, if I add "Distinct" to my expression as
Count(Distinct {<[Status of Candidate]-={'Completed'}>} Key_Requisition_Candidate)
But, if I removed "Distinct" in the expression as
Count({<[Status of Candidate]-={'Completed'}>} Key_Requisition_Candidate)
the problem shows up again.
Why the distinct/total modifier makes a difference here, if Qlik Sense should sort bars based on the values calculated no matter what formula we use? Qlik Sense does not seem to respect the calculated values, when distinct/total modifier is not used, when set analysis is involved.
- Mark as New
- Bookmark
- Subscribe
- Mute
- Subscribe to RSS Feed
- Permalink
- Report Inappropriate Content
I think you're misunderstanding what TOTAL does. Adding TOTAL <recruiter> to your expression will make it calculate the count values at the level of the recruiter dimension instead of at the level of the combination of the two dimensions {recruiter,step of candidate}.
talk is cheap, supply exceeds demand
- Mark as New
- Bookmark
- Subscribe
- Mute
- Subscribe to RSS Feed
- Permalink
- Report Inappropriate Content
I figure out the source of the problem. The measure of my chart is
Count(Distinct {<[Status of Candidate]-={'Completed'}>} Key_Requisition_Candidate)
The expression of my sort is
Count({<[Status of Candidate]-={'Completed'}>} Key_Requisition_Candidate)
This is why the sorting is not working as expected. I wish Qlik Sense has a way to drag my measure and drop to the sorting expression to avoid the problem. Because I have to type the sorting expression manually, I missed the "distinct" in my expression. So, Qlik Sense is working as expected.
Thank you all for your feedback.
- Mark as New
- Bookmark
- Subscribe
- Mute
- Subscribe to RSS Feed
- Permalink
- Report Inappropriate Content
Agree with Gysbert. The <Total> is an instruction to determine the LEVEL of aggregation , it doesn't change the actual aggegation function ( count) that is being used.
Like this:
Count( total <recruiter> Distinct {<[Status of Candidate]-={'Completed'}>} Key_Requisition_Candidate)