Unlock a world of possibilities! Login now and discover the exclusive benefits awaiting you.
- Qlik Community
- :
- Forums
- :
- Groups
- :
- Industry and Topics
- :
- Healthcare
- :
- Re: Centralized BI/Analytics Department
- Subscribe to RSS Feed
- Mark Topic as New
- Mark Topic as Read
- Float this Topic for Current User
- Bookmark
- Subscribe
- Mute
- Printer Friendly Page
- Feature this Topic
- Mark as New
- Bookmark
- Subscribe
- Mute
- Subscribe to RSS Feed
- Permalink
- Report Inappropriate Content
Centralized BI/Analytics Department
Is there anyone out there who is organized as a "Centralized" BI/Analytics group that is responsible for the the entire network/organization?
- Tags:
- Group_Discussions
Accepted Solutions
- Mark as New
- Bookmark
- Subscribe
- Mute
- Subscribe to RSS Feed
- Permalink
- Report Inappropriate Content
Yes and partially No.
For 4 years the support for and development of Qlikview applications was done solely by my team in IT. We built all of the apps. We did all of the training. We approved/disapproved of the projects we worked on. We answered the phone with questions.
My implementation strategy all along was to take advantage of the ridiculously cool collaboration features within Qlikview. As "Sally Sue financial guru" moved up the chain to "Sally Sue Business Analyst" and really took to Qlikview we spent more and more time helping her understand how to enhance the application. Suddenly Sally Sue was a "super user" and could build her own charts. Now we had BA's embedded in groups and since Qlikview allows those embedded users to SHARE any objects they develop Sally Sue financial guru, turned Sally Business Analyst transitioned further into Sally Sue long right arm of Dalton in "BI/Analytics" Sally Sue could respond more quickly to what her superiors needed.
Eventually Sally Sue became quite good at not only modifying existing content but adding her own content. If I know you Dan, your next question is going to be "how in the world could Sally Sue add her own data sources?" Great question my friend ... We use SharePoint internally and I simply create sites for each project. As you know one of the great beauties of Qlikview is it's Associative Data Model. All I had to do was put code in my base applications that says "Go do a LOAD * from any XLS or CSV files in this path." Boom Sally Sue can add content. She finds a way to get her hands on Budget data from someone, and she drops into her "application data store" on QV. Providing she names the columns correctly so that one of the field names matches a Primary Key in some centrally developed data she has just extended the abilities of the application that were centrally designed.
Sally Sue is now quite the little heroine correct? But a pain in my butt. "Wah wah wah. I added 18 new things that are heavily used why can't I share an entire screen. Why can't I do ETL things to the data from my extended data sources?" Just kidding ... those were all great things. She was the DATA CHAMPION for her business unit and did work that I didn't have to. She was the person who had earned the TRUST over the years within that organization and thus she added credibility to the application(s) she touched and supported. Thus she moved the data from "Dalton did it and we don't know that guy" to "Sally Sue stands behind it." BAM. Not only did Sally Sue move up the BI Skill Continuum she took the application up the ladder from "not sure if we should use this" to this application provides ACTIONABLE INTELLIGENCE.
Sally Sue now has full rights to develop her own applications from scratch accessing any of our centrally extracted data files that we save into what we call our QVD Store.
Thus Yes my team is responsible for the entire infrastructure in many aspects, but the grand beauty of the Qlikview architecture is that even when that is the case end users can grow dramatically and provide astronomical value to the organization and the process, and eventually change the process.
Disclaimer: The hypothetical name "Sally Sue" has such a flare to it that I love to use it. In this case the real Sally Sue that championed our skill continuum, increased adoption in their area and forced process change is actually named Jeff.
- Mark as New
- Bookmark
- Subscribe
- Mute
- Subscribe to RSS Feed
- Permalink
- Report Inappropriate Content
Dalton, you're awesome! My next question is this; Have you developed any metrics by which to measure your centralized "BI/Analytics" group? We are looing for ways in which we can measure ourselves (I'm 5 ft. 10 in and shrinking), in a way that can be reported up the organizational ladder.
- Mark as New
- Bookmark
- Subscribe
- Mute
- Subscribe to RSS Feed
- Permalink
- Report Inappropriate Content
I was just asked the other day if I had any quantitative way of measuring the value of some of the applications that we have built. What a complicated thing to do in our line of work.
Let's say that we build an application that enables the company to effectively do staffing on demand. If that effort saves the company 3,390 man hours per week then we obviously have an easily measured ROI right? It costs $10 for my salary, it costs $20 for Qlikview licenses and servers and we save 18 million per year in salaries. Love it.
But what if that same application was intended more to improve patient care and reduce bottlenecks and thus we demonstrate that we need 3,390 additional man hours per year at these exact hours of the day and days per week in order to speed up the clinical work flow to discharge patients sooner and increase patient satisfaction levels. Bummers nobody is standing in line to put bonus money into our pockets now.
Obviously we had a huge impact but even something like dollars that any other industry can quantify isn't really a sure fire indicator of our "effectiveness."
My next blog post, selfless promotion. is going to be on "Visualizing User Adoption." One of the things I'm going to discuss is this very topic. What does "adoption" look like? Is it the number of people that use the application? Wow I got 193 people using the application. Sounds good right. What if they all use it for 1 minute per day and only have 1 click each? Is that truly an "analytical application." Or is it a pretty Qlikview rendition of a canned report that probably could have been emailed to them straight out of the databse.
Does adoption involve the amount of minutes that users spend in the application? That's more straight forward right? Except do we then need to start looking at averages or medians instead of just the total? If we do that do we need to exclude outliers? Or is an outlier really a good thing in terms of using an analytical application. Meaning why should I exclude that analytic zombie who spends 12 hours straight working in an application?
For sales a trend is always a great way to measure effectiveness. But is it a good way to measure an analytical application. Upper management will love you when you show them a positive trend "look boss this application had 100 minutes of usage in January, 200 in February, 400 in March etc." But what if your application had an upward trend for a short period and now is trending downward? is that a sign of poor performer or is that the sign of a great performer. You enabled the company to recognize and take action on a poorly performing process and now it is no longer a real issue?
But how do we know that we should have more of users, or minutes? The applications we build are constructed with completely different purposes and have far different groups consuming them. You may build the most important application in the companies history but the target group is only 5 people. While I may build an application to show people how much vacation time they've accumulated. A statistic they could connect 18 ways to Sunday to see but they use my application.
hen I'm looking at how I would measure these things, I become an Analyst myself. Only the data is my own. So how do I avoid choosing the measurements metrics that make me look best. I see a pattern for my favorite 3 applications, the ones I'm most proud of, the ones I worked on the most and so I choose the measurements that make those applications look best. Human nature. I'm guilty.
I just read a very interesting study someone had shared about forming 30 analytic teams and giving them a problem to solve. They were asked to prove if a certain situation proved/disproved a theory that involved race bias in sports in some way. My problem with the study was that what I believed it really proved was that the people working tried to use the data to prove their own bias in one way or another. What I think they should have done was blinded the data in a way that the analysts had no idea what they were proving or disproving. And simply used the data. Now I can't even trust myself to look at data in a Session.Log fairly.
If this were sales we would build a budget ... we expect that Dan's application should be used by 5 people and that they will use it 3 times per week for 15 minutes each time. But that's impossible for us. If you knew it would take 5 people spending 45 minutes each week to solve the problem, then you'd build a better application that just solved the problem. We can't even guess how long it should take people to do analysis. We can't guess how many people may catch on and become really good at analyzing the data. We can't predict how many problems we will surface through our tools that weren't even being asked about when we got started.
Crud ... now I just gave away the points for my blog post and I'll have at least 1 fewer readers. Now how do I measure the worthiness of my post?
On a serious note Dan ... I would love to speak with you about your thoughts on this. As I'm seriously writing about this over the next few days. I would love to get your input and thoughts. I love that this community is actually beginning to move in a direction where we are all seeking answers to some really tough questions. My cell is 678-943-0064 if you do have some time to chat this through.
- Mark as New
- Bookmark
- Subscribe
- Mute
- Subscribe to RSS Feed
- Permalink
- Report Inappropriate Content
I asked you in our conversation when you use QlikView versus SSRS. You gave a short answer that I have forgotten. Can you provide that for me again? Thanks!
- Mark as New
- Bookmark
- Subscribe
- Mute
- Subscribe to RSS Feed
- Permalink
- Report Inappropriate Content
To me the distinction is when someone just wants a static set of data and are happy just receiving it via email. While I'd rather someone learn how to fish and use analytics because I think they add more value to the company that way (I will attach chart that shows what I mean) there are times when workflows simply require lists that are static and I get that so I just hand them a well prepared fish and let them eat.
Currently our "canned reporting" has to go through SSRS because we do not yet have NPrinting. Kind of drives me nuts because we do a lot of research to build the canned reports and our end result is just the canned reports in many cases. If we did have NPrinting we could extract and surface the data through it in the same manner on a well defined and published schedule, but immediately be able to surface the data in a Qlikview application as well.
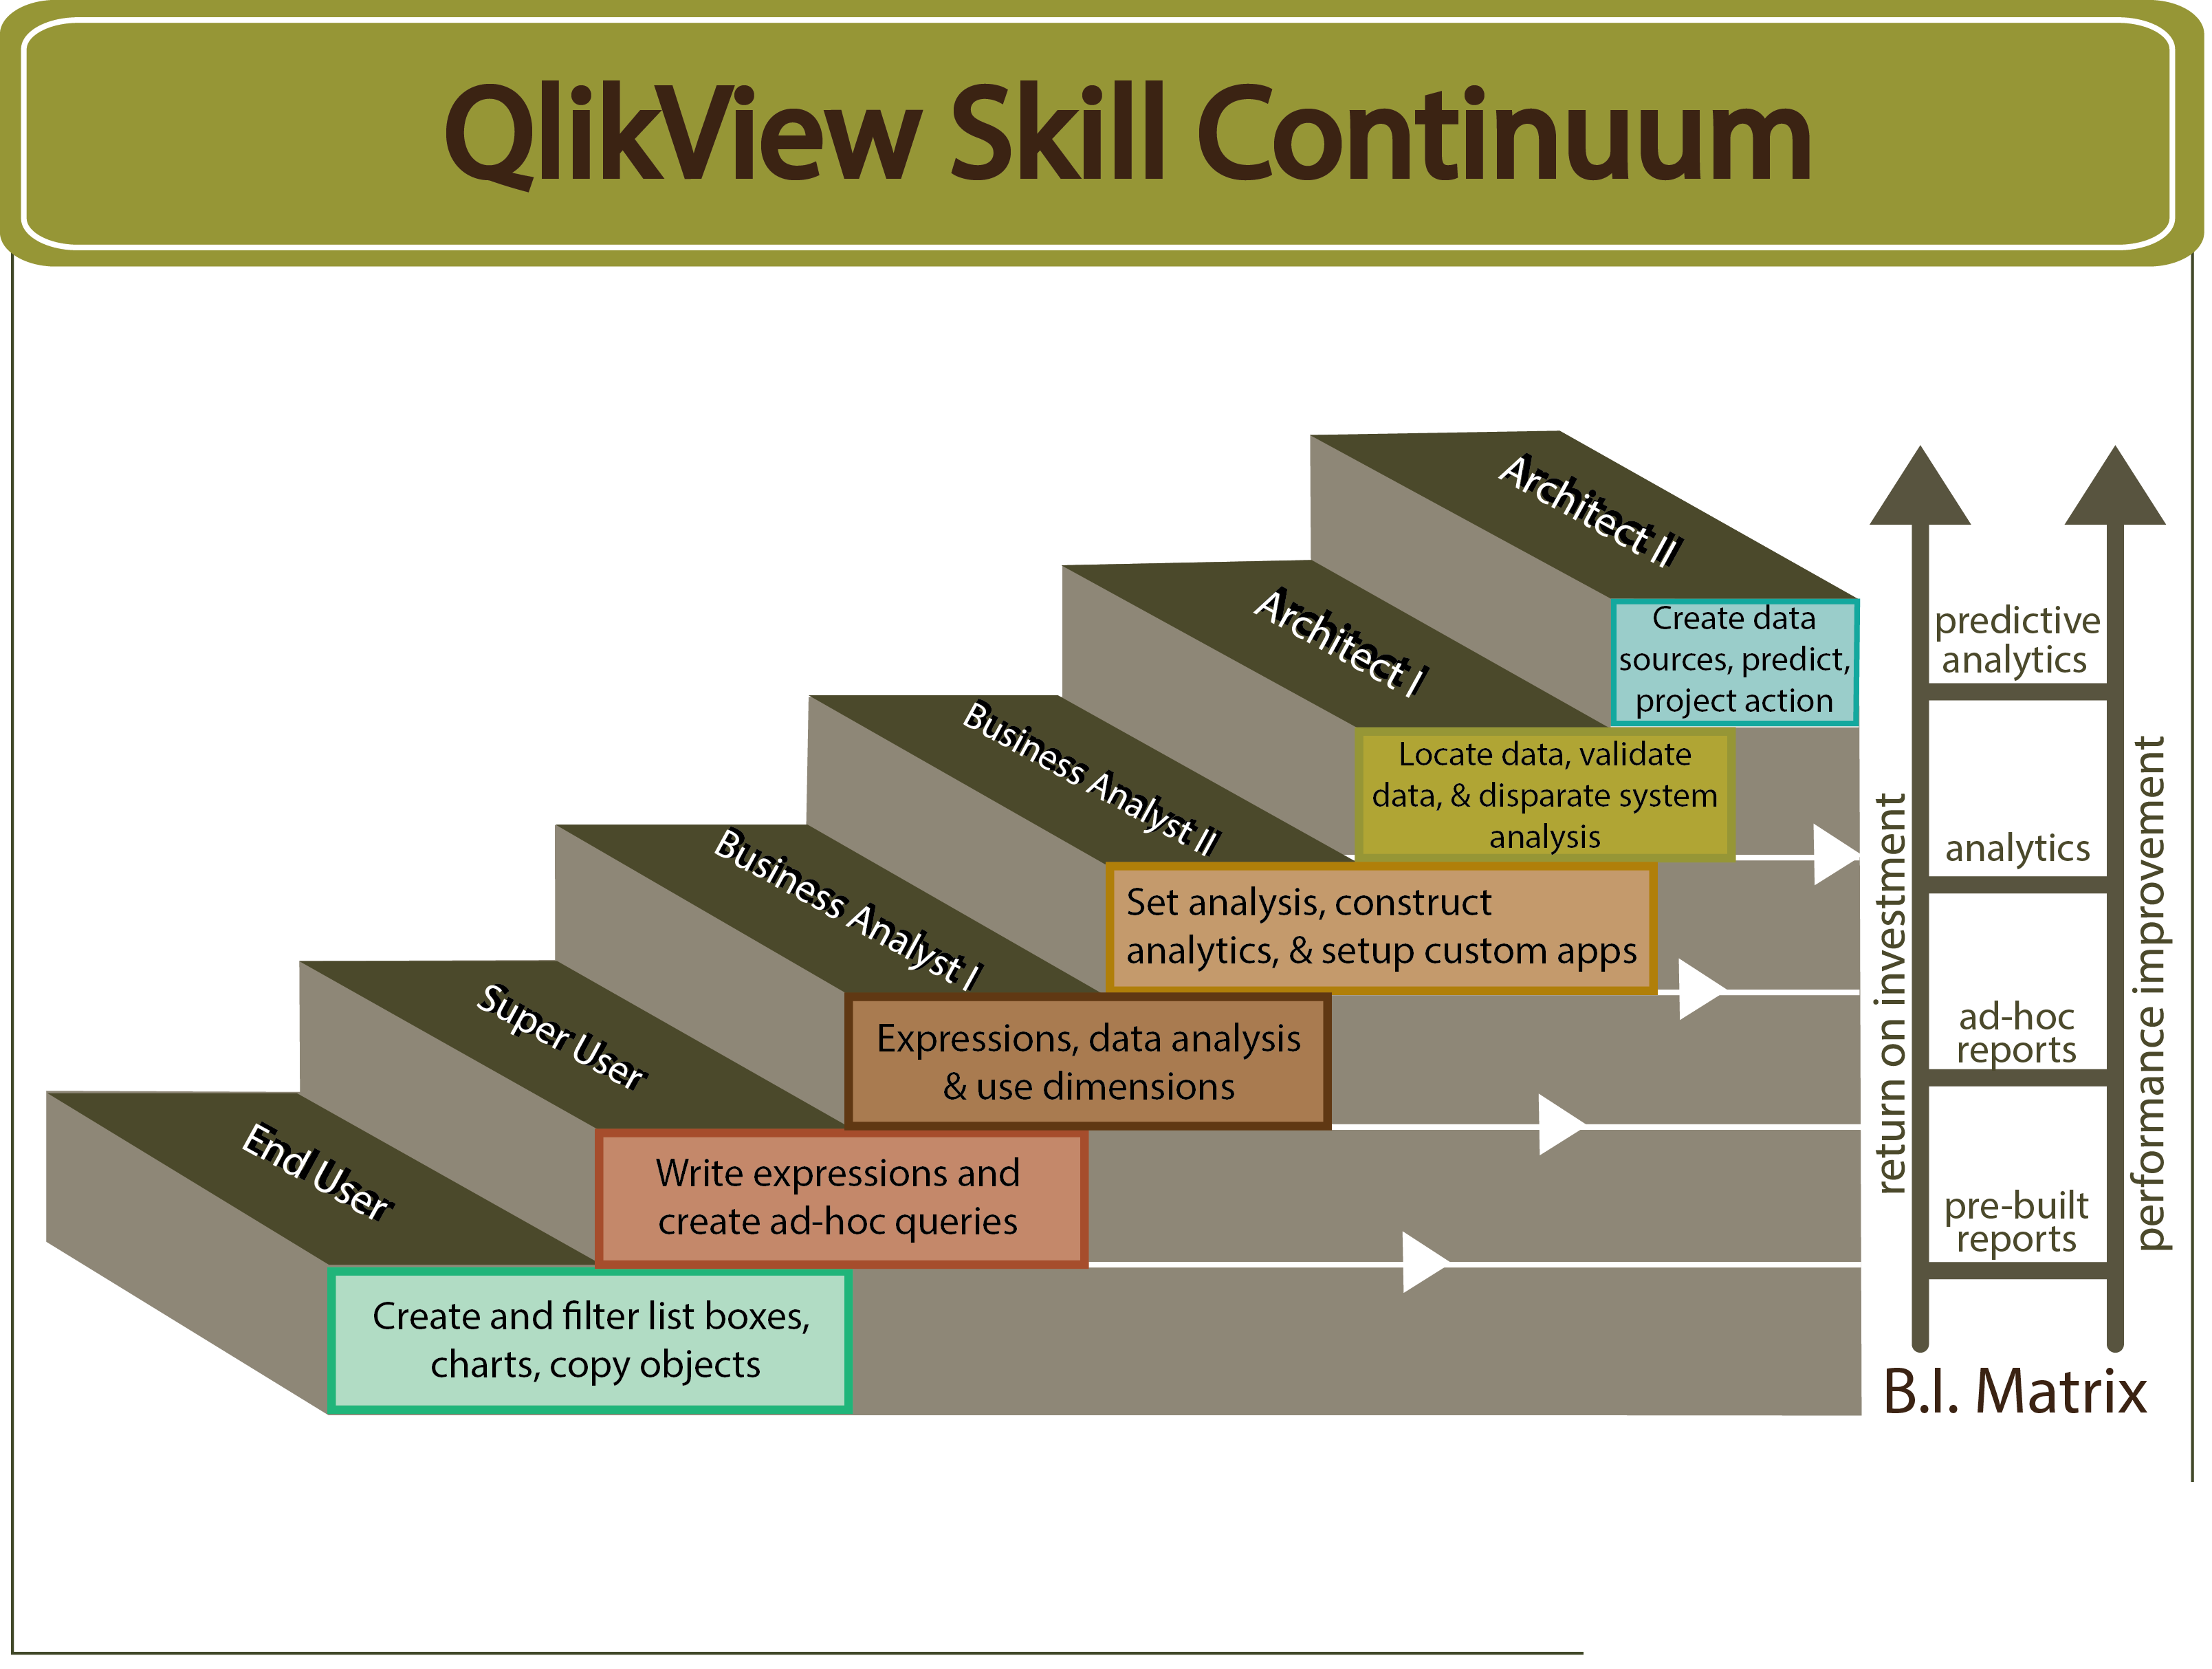
Continuum - This what I refer to within my hospital. The functional titles are just "theoretical functional titles" and merely illustrate the level of skill someone has. So assume that Sally Sue, RN who works in the Case Management group can simply use the Directed Analytics applications that I provide. She then is an "End User" in terms of her "knowledge worker" role and provides a certain level of return on investement (right side of the chart.) As Sally Sue progresses in her learning and can copy charts and make changes let's say she not only progresses in her "knowledge worker" role's her work is moving up the ladder in terms of ROI for the company in terms of its data. I will have something more formal on this in the future. Hoping to collaberate with a particular group to really make this come to life.