Unlock a world of possibilities! Login now and discover the exclusive benefits awaiting you.
- Qlik Community
- :
- Forums
- :
- Analytics
- :
- New to Qlik Analytics
- :
- Re: Limit Top 10 by Expression
- Subscribe to RSS Feed
- Mark Topic as New
- Mark Topic as Read
- Float this Topic for Current User
- Bookmark
- Subscribe
- Mute
- Printer Friendly Page
- Mark as New
- Bookmark
- Subscribe
- Mute
- Subscribe to RSS Feed
- Permalink
- Report Inappropriate Content
Limit Top 10 by Expression
Hey guys,
My problem is that I have a table with 4 measures and I want to limit the table to the top 10 based on the expression in the 3rd column (Increase #) while leaving that column in that place for presentation purposes.
Right now it looks like this:
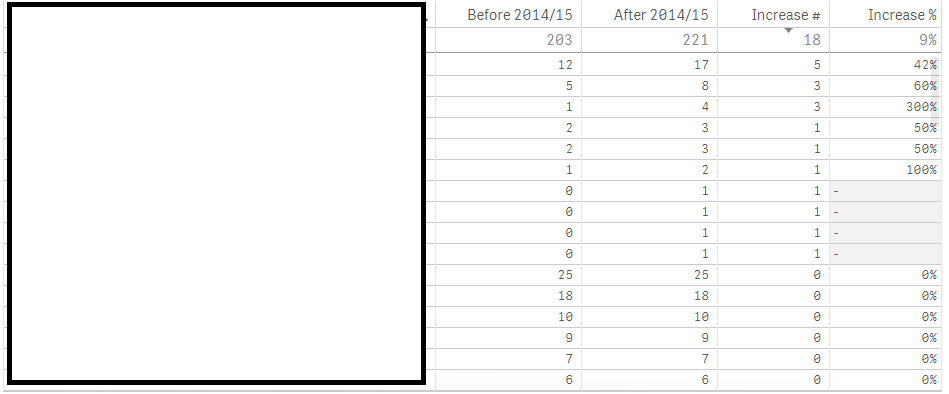
When I limit by top 10 it limits by measure 'Before 2014/15' when I want it to limit by 'Increase #'.
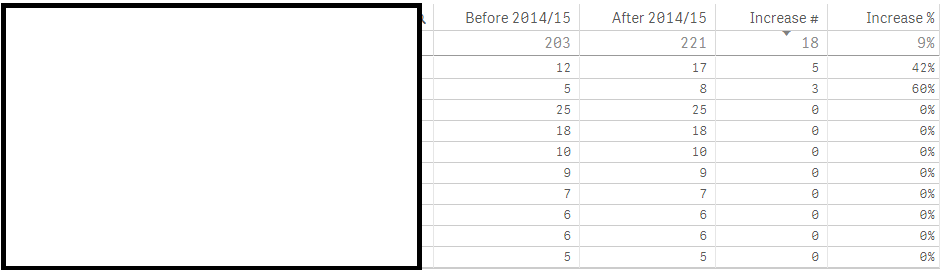
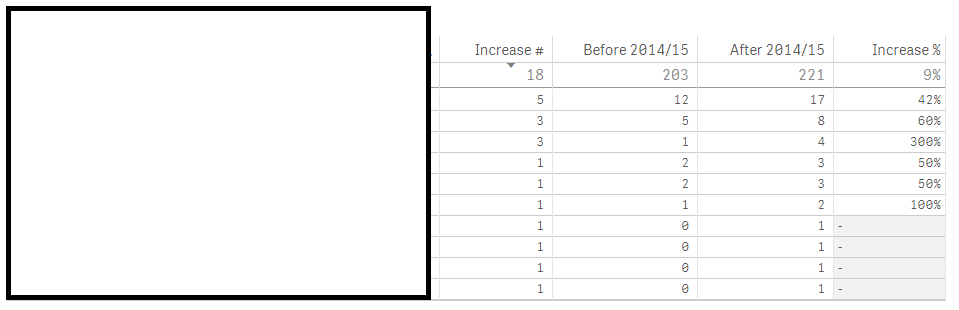
I get this to work by moving the 'Increase #' measure over to the furthest left, but I want it to stay in its column position in the above 2 pictures for presentation purposes.
I also wanted to limit to top 10 a bar chart with the same expression that 'Increase #' has without actually having that measure in the bar chart.
Is there any way this can be achieved?
- « Previous Replies
-
- 1
- 2
- Next Replies »
- Mark as New
- Bookmark
- Subscribe
- Mute
- Subscribe to RSS Feed
- Permalink
- Report Inappropriate Content
Hi James.
I think yes. Probably with Rank function.
Could you provide the sample of your app?
Regards,
Sergey
Sergey
- Mark as New
- Bookmark
- Subscribe
- Mute
- Subscribe to RSS Feed
- Permalink
- Report Inappropriate Content
Hi Sergey,
Unfortunately I can't provide the app, but the 'Increase #' expression is:
Count({$<Title_Status = {'Active'}, Fee_Fiscal_Year = {'2014/15'}>}Title) -
Count({$<Title_Status = {'Active'}, Fee_Fiscal_Year = {'2013/14'}>}Title)
And the before 2014/15 expression is:
Count({$<Title_Status = {'Active'}, Fee_Fiscal_Year = {'2013/14'}>}Title)
Is there a way I can incorporate the Rank function into these?
- Mark as New
- Bookmark
- Subscribe
- Mute
- Subscribe to RSS Feed
- Permalink
- Report Inappropriate Content
Try something like this:
For 'Increase #'
IF(Rank(
Count({$<Title_Status = {'Active'}, Fee_Fiscal_Year = {'2014/15'}>}Title) -
Count({$<Title_Status = {'Active'}, Fee_Fiscal_Year = {'2013/14'}>}Title)
)<11,
Count({$<Title_Status = {'Active'}, Fee_Fiscal_Year = {'2014/15'}>}Title) -
Count({$<Title_Status = {'Active'}, Fee_Fiscal_Year = {'2013/14'}>}Title)
)
For before 2014/15 expression
IF(Rank(
Count({$<Title_Status = {'Active'}, Fee_Fiscal_Year = {'2014/15'}>}Title) -
Count({$<Title_Status = {'Active'}, Fee_Fiscal_Year = {'2013/14'}>}Title)
)<11,
Count({$<Title_Status = {'Active'}, Fee_Fiscal_Year = {'2013/14'}>}Title)
)
Sergey
- Mark as New
- Bookmark
- Subscribe
- Mute
- Subscribe to RSS Feed
- Permalink
- Report Inappropriate Content
Hi Sergey,
Unfortunately that's not working for me, and I'm not sure how to incorporate that into my bar chart.
This would be so much easier if I could limit top 10 by an expression which isn't in the chart.
- Mark as New
- Bookmark
- Subscribe
- Mute
- Subscribe to RSS Feed
- Permalink
- Report Inappropriate Content
Hi,
1. add another column and move it to the top as column1.
2. Put Column(4) as Expression. The one which was column 3 before.
3. Use Dimension Limits to narow down to top 10
Hope this helps
Tobias
- Mark as New
- Bookmark
- Subscribe
- Mute
- Subscribe to RSS Feed
- Permalink
- Report Inappropriate Content
Hi Tobias,
Thanks for the suggestion. I would do that, but I would then have 2 identical columns in my table.
I'm also getting an internal engine error whenever I do that too.
Plus I'm not able to copy over this measure to my bar graph below, which I only want to limit by the measure while not incoprporating it into the bar chart.
Is this a feature which Qlik Sense currently does not have?
- Mark as New
- Bookmark
- Subscribe
- Mute
- Subscribe to RSS Feed
- Permalink
- Report Inappropriate Content
Hi James,
Check if this helps you.
Thanks,
AS
- Mark as New
- Bookmark
- Subscribe
- Mute
- Subscribe to RSS Feed
- Permalink
- Report Inappropriate Content
Hey Amit,
Thanks for that, but when I downloaded them no sheets were available on the app. I'm using Qlik Sense if that makes a difference.
- Mark as New
- Bookmark
- Subscribe
- Mute
- Subscribe to RSS Feed
- Permalink
- Report Inappropriate Content
Sorry James no idea on this , but concept wise please see below:
Ranking Concept:
Syntax:
=rank(sum(Investment),1,1)
AND
=aggr(if(Rank(sum(Investment))<=3,Investment),Investment) (For calculating Top 3)
AND
=if(rank(sum(Investment),1,1)=1,'# 1')
I have a data table which includes the following fields; SystemID, Timestamp.
I want to derive a new field in this table which ranks the Timestamp in ascending grouped by SystemID
I'd like to do this in the script.
- e.g.
SystemID, Timestamp, [Rank]
00001, 01/01/2013 10:00, 1
00001, 01/01/2013 12:00, 2
00001, 01/01/2013 12:30, 3
00002, 01/01/2013 11:00, 1
00002, 01/01/2013 12:12, 2
00003, 01/02/2013 10:30, 1
Syntax:
LOAD
SystemID, Timestamp,
if(SystemID=previous(SystemID),peek('Rank')+1,1) as Rank
FROM ...mysource...
ORDER BY SystemID, Timestamp;
Thanks,
AS
- « Previous Replies
-
- 1
- 2
- Next Replies »