Unlock a world of possibilities! Login now and discover the exclusive benefits awaiting you.
- Qlik Community
- :
- All Forums
- :
- QlikView App Dev
- :
- Struggling with Calculating Totals
- Subscribe to RSS Feed
- Mark Topic as New
- Mark Topic as Read
- Float this Topic for Current User
- Bookmark
- Subscribe
- Mute
- Printer Friendly Page
- Mark as New
- Bookmark
- Subscribe
- Mute
- Subscribe to RSS Feed
- Permalink
- Report Inappropriate Content
Struggling with Calculating Totals
Hi
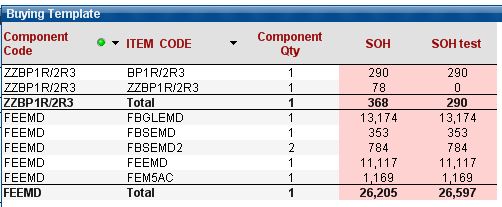
I am struggling to calculating a total in a straight chart table. Above is an extract of my chart table showing stock on hand (sales value are hidden for simplicity)
My formula above for Stock on Hand (SOH) is:
SUM({$<[Sales Status]=>} [Loc Qty On Hand]))* [ComponentQty].
However the total for FEEMD is incorrect and should be 26,597 and not 26,205
Reason the Sales Status field is excluded from selection is that for ZZBP1R/2R3 there is no sales but there is Stock on Hand (SOH)
I then created a new column called SOH test with the following formula:
sum(aggr(RangeMax((SUM({$<[Sales Status]=>} ([Loc Qty On Hand])))*$(vComponent_Qty)), [ITEM CODE],[Component Code]))
The total is fine, however the SOH for ZZBP1R/2R3 is zero instead of 78 .
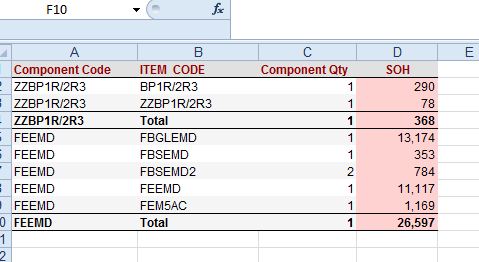
The correct result should be as follows:
Please can you help.
Thank you
kind regards
Nayan