Unlock a world of possibilities! Login now and discover the exclusive benefits awaiting you.
- Qlik Community
- :
- All Forums
- :
- QlikView App Dev
- :
- Add Target point on the bar chart
- Subscribe to RSS Feed
- Mark Topic as New
- Mark Topic as Read
- Float this Topic for Current User
- Bookmark
- Subscribe
- Mute
- Printer Friendly Page
- Mark as New
- Bookmark
- Subscribe
- Mute
- Subscribe to RSS Feed
- Permalink
- Report Inappropriate Content
Add Target point on the bar chart
Hi,
I would like to create a bar chart which display region sales amount by Month Year. I also want to add sales target points on the bar chart like below:
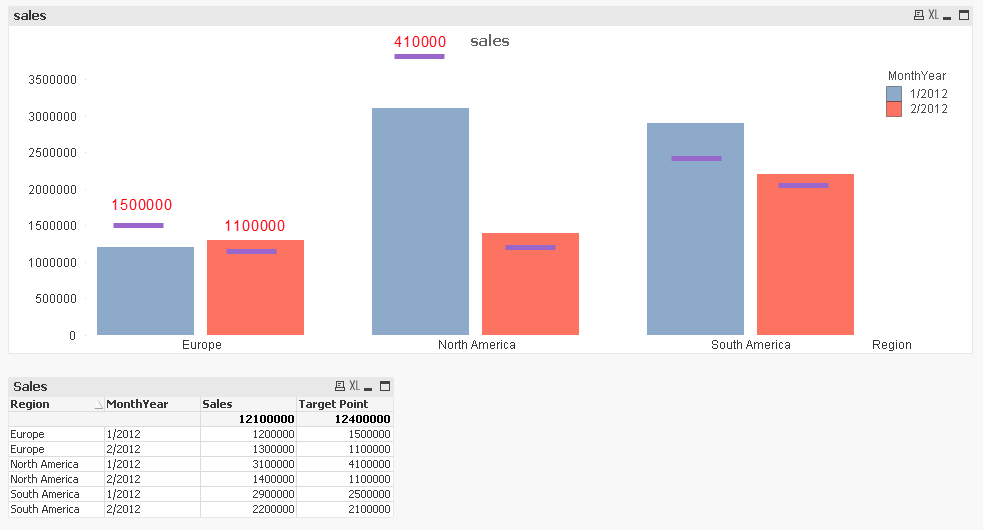
How can I add those target points?
Thanks.
- Mark as New
- Bookmark
- Subscribe
- Mute
- Subscribe to RSS Feed
- Permalink
- Report Inappropriate Content
You can do that by using Error Bars as explained in this blog post: Bar chart target lines in QlikView (The Qlik Fix!)
talk is cheap, supply exceeds demand
- Mark as New
- Bookmark
- Subscribe
- Mute
- Subscribe to RSS Feed
- Permalink
- Report Inappropriate Content
Hi Gysbert,
Thank you for your suggestion. Can I show value on data point of Error Bars?
- Mark as New
- Bookmark
- Subscribe
- Mute
- Subscribe to RSS Feed
- Permalink
- Report Inappropriate Content
you can add one more expression which will be calculating the target sum
and then on expression tab uncheck 'bar' checkbox and check 'values on data points'.
- Mark as New
- Bookmark
- Subscribe
- Mute
- Subscribe to RSS Feed
- Permalink
- Report Inappropriate Content
Hi Alexandra,
Thank you for your reply. I tried your method, but the data point are shown on top of the bars.
The data point I would like to show are on the top of error bars.
- Mark as New
- Bookmark
- Subscribe
- Mute
- Subscribe to RSS Feed
- Permalink
- Report Inappropriate Content
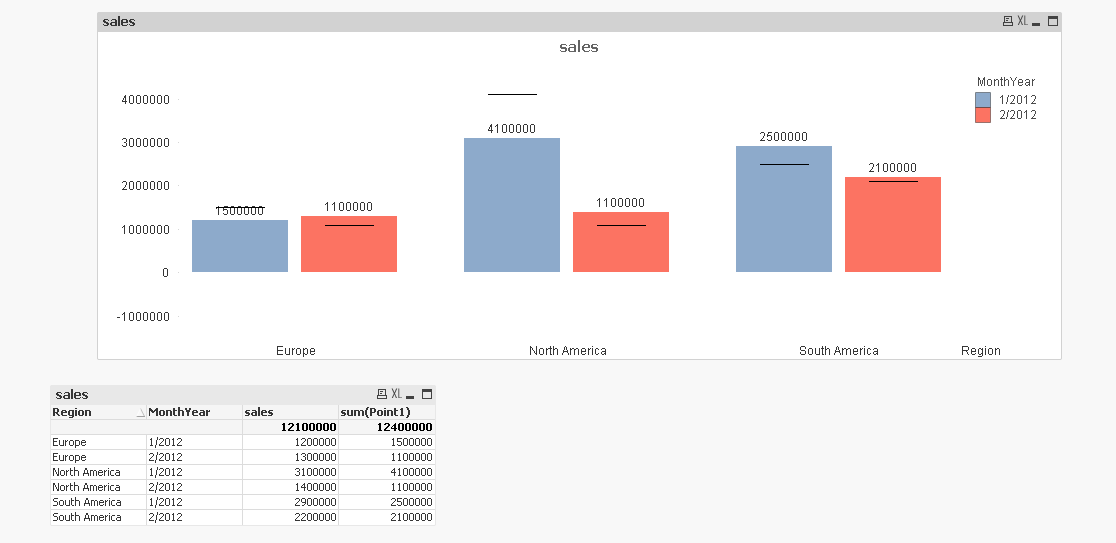
try this:
create second expression which is
dual(
sum(point1),
sum(point1) - sum(sales)
)
, give it argb(0,255,255,255) - transparent color
have a stacked bar chart and add show value on data points for this expression
- Mark as New
- Bookmark
- Subscribe
- Mute
- Subscribe to RSS Feed
- Permalink
- Report Inappropriate Content
try using this as a starting point