Unlock a world of possibilities! Login now and discover the exclusive benefits awaiting you.
- Qlik Community
- :
- All Forums
- :
- QlikView App Dev
- :
- Re: Variable in expression in straight table
- Subscribe to RSS Feed
- Mark Topic as New
- Mark Topic as Read
- Float this Topic for Current User
- Bookmark
- Subscribe
- Mute
- Printer Friendly Page
- Mark as New
- Bookmark
- Subscribe
- Mute
- Subscribe to RSS Feed
- Permalink
- Report Inappropriate Content
Variable in expression in straight table
Hi
I have managed to setup a variable in a straight table/chart name
='Ageing History Performance ' & '$(vShowChart)'
The Values in vShowChart are 120Days+, 150Days+ and 180Days+
Now I want to add this into an expression as well so I only have one chart, not three. I am missing something somewhere. Please help
The current Expression in the charts are SUM({<Type={'Current'}>}H120DaysPlus), then the second chart SUM({<Type={'Current'}>}H160DaysPlus) and the 3rd chart SUM({<Type={'Current'}>}H180DaysPlus)
I tried this but, the Expression box says the syntax is OK, but it is not givig through any values
SUM(If(Type='Current' and $(vShowChart) = '120Days+', H120DaysPlus),If(Type='Current' and $(vShowChart) = '150Days+', H150DaysPlus),If(Type='Current' and $(vShowChart) = '180Days+', H180DaysPlus)))
Accepted Solutions
- Mark as New
- Bookmark
- Subscribe
- Mute
- Subscribe to RSS Feed
- Permalink
- Report Inappropriate Content
May be this:
=If(vShowChart = '120Days+', SUM({<Type={'Current'}>}H120DaysPlus),
If(vShowChart = '150Days+', SUM({<Type={'Current'}>}H150DaysPlus),
If(vShowChart = '180Days+', SUM({<Type={'Current'}>}H180DaysPlus))))
Best,
Sunny
- Mark as New
- Bookmark
- Subscribe
- Mute
- Subscribe to RSS Feed
- Permalink
- Report Inappropriate Content
I got zero values on this one, sorry, sunindias one is working though. I have an extra question on that one though which I will ask in sunindias answer
- Mark as New
- Bookmark
- Subscribe
- Mute
- Subscribe to RSS Feed
- Permalink
- Report Inappropriate Content
This works really well
I put this same code into another piece of code, it is working but for sum reason it is not totalling correctly
| If(RowNo()=1, | (Bottom(If(vShowChart = '120Days+', SUM({<Type={'Current'}>}H120DaysPlus), |
If(vShowChart = '150Days+', SUM({<Type={'Current'}>}H150DaysPlus),
If(vShowChart = '180Days+', SUM({<Type={'Current'}>}H180DaysPlus)))))), Above(Previous1))
The original code for the 120Day+ is 100% but the moment I add the extra code the figures are wrong. Can you see something obviously wrong which could cause this issue?
| If(RowNo()=1, | (Bottom(sum({<Type={'Previous'}>} H120DaysPlus))), Above(Previous1)) |
- Mark as New
- Bookmark
- Subscribe
- Mute
- Subscribe to RSS Feed
- Permalink
- Report Inappropriate Content
Are you using this expression in a straight table or pivot table???
- If this is in the straight table, have you tried using Sum for total mode instead of using the expression total.
- If this is in the pivot table, then you might need to use Aggr function.
In any case, I will need to look at the table to give you better solution.
Best,
Sunny
- Mark as New
- Bookmark
- Subscribe
- Mute
- Subscribe to RSS Feed
- Permalink
- Report Inappropriate Content
It is a straight table, not sure exactly but what you mean with the sum for total mode. I am attaching a reduced model for you. You will see there is an opening balance which is the previous months closing balance. I brought this in to calculate the Reduction column. I get this data from the previous1 column. It works perfectly if I do a chart per ageing period, i.e. 120, 150, 180, but No I am trying to get smarter code and have one chart instead of three. The other code you gave me for this is in the Actual column. That works perfectly as well.
Hope I am not just missing something silly, or making a obvious mistake.
Compare the first and second straight table for Ageing History Performance 120Days+, the first one has the correct values
If you need to have a look at the code behind it the hidden script password is Qlikview
- Mark as New
- Bookmark
- Subscribe
- Mute
- Subscribe to RSS Feed
- Permalink
- Report Inappropriate Content
For Total mode, look at this expression:
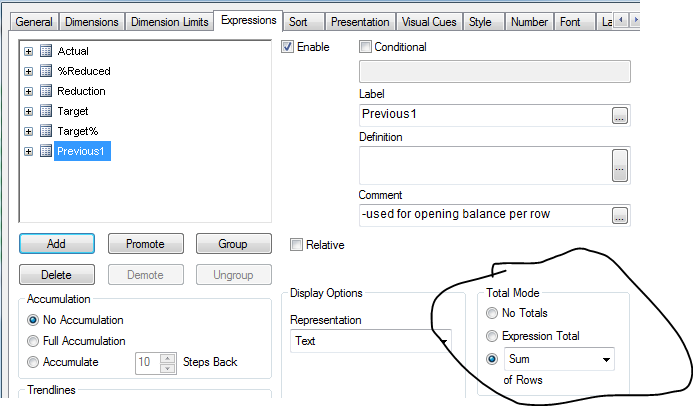
also find attached the application ans see if this is what you want???
PFA
- Mark as New
- Bookmark
- Subscribe
- Mute
- Subscribe to RSS Feed
- Permalink
- Report Inappropriate Content
Thanks so much for the help
On Fri, Apr 24, 2015 at 2:15 PM, Vikram Vangala <qcwebmaster@qlikview.com>