Unlock a world of possibilities! Login now and discover the exclusive benefits awaiting you.
- Qlik Community
- :
- All Forums
- :
- QlikView App Dev
- :
- Re: Display data point values on line chart
- Subscribe to RSS Feed
- Mark Topic as New
- Mark Topic as Read
- Float this Topic for Current User
- Bookmark
- Subscribe
- Mute
- Printer Friendly Page
- Mark as New
- Bookmark
- Subscribe
- Mute
- Subscribe to RSS Feed
- Permalink
- Report Inappropriate Content
Display data point values on line chart
Hi there,
I have a line chart with an x-axis time series (which is updated each day with the latest information). The user can select the point in time which they want to view the line chart or default latest update day (today). Because of the number of value points on the line chart it is difficult to see the data values.
Is it possible to restrict the data values to only the selected (latest) date? This means there is only one value visible on the line chart (the last one).
Have tried using the 'Show Value' field but have not been successful. The 'TODAY' function works only if the default value is selected (today). Once the user selects a date prior to today the field does not show.
Thanks
- Tags:
- new_to_qlikview
- Mark as New
- Bookmark
- Subscribe
- Mute
- Subscribe to RSS Feed
- Permalink
- Report Inappropriate Content
JOHN UR THE MAN!!!!!
thanks
- Mark as New
- Bookmark
- Subscribe
- Mute
- Subscribe to RSS Feed
- Permalink
- Report Inappropriate Content
Hi all,
Have taken some time on this one (been on the backburner while other items were addressed) but I believe I have a simple answer. To display only the selected date on a line chart use the following script in the Show Value definition of the expression:
Cheers
Karl
REFRESH_DATE =GetFieldSelections (REFRESH_DATE)
- Mark as New
- Bookmark
- Subscribe
- Mute
- Subscribe to RSS Feed
- Permalink
- Report Inappropriate Content
I have a variation of this post that this solution does not quite address and I would like some help.
If I chart all the possible values for Date, I want to display the value of last date in the line chart regardless of what date is selected. Both Karl and John's solutions seem to display only the value associated with the date selected.
Any thoughts on how to address.
- Mark as New
- Bookmark
- Subscribe
- Mute
- Subscribe to RSS Feed
- Permalink
- Report Inappropriate Content
Hi all,
I need to display the value of last date in the line chart regardless of the date user selects. Do you have any I dea how I can do it?
thanks ,
- Mark as New
- Bookmark
- Subscribe
- Mute
- Subscribe to RSS Feed
- Permalink
- Report Inappropriate Content
You need a separate expression to select to show the value on the data points (as described above). Start by putting the identical expression to check you get the value on every point.
When that is working wrap the expression like this:
=if(DateDim = $(=max(DateDim)), [your current expression], ' ')
This assumes the dimension on the chart is DateDim, the square brackets and the code to be replaced with the expression you have on the line.
If you have date points beyond where you line ends (i.e. dates with a zero value for the line) you will need to apply Set Analysis to the max, e.g. $(=max({<MyValue={"<>0"}>}DateDim)) , this will ensure the date you show a value is a date that is actually displayed on the line.
Hope that helps.
- Mark as New
- Bookmark
- Subscribe
- Mute
- Subscribe to RSS Feed
- Permalink
- Report Inappropriate Content
Hi guys,
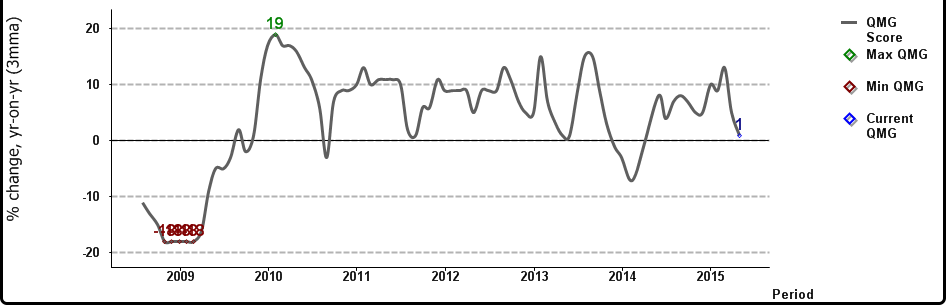
Have just implemented this and I love how it is dynamic in providing me what I need. I currently use it to highlight the high, low and latest values over a specific period of time.
Problem I have is when some values - in this example, the low values - are multiple ones. If you look at the image it shows -18 in red as the low value which happens a few months in a row.
I want to know if there is a way to just show the latest 'low' value - ie just the latest -18.
Currently the code that calculates the Min Values score is =if(Rank(-avg([QMG Score]))=1,avg({<Period=>}[QMG Score]))
The dimension of the chart is just something called Period - eg 31/12/14
- Mark as New
- Bookmark
- Subscribe
- Mute
- Subscribe to RSS Feed
- Permalink
- Report Inappropriate Content
There are a number of different ways you can handle hitting the same value using the Rank function, using an extra parameter, one of these may help.
If not you could add the period to the score, but make sure it is a secondary factor in the rank by multiplying the score, eg:
Rank((-avg([QMG Score]) * 1000000) + Period)
Depending on whether you wanted the first or last point marked you could either add or remove the period value.
Hope that makes sense.
Steve
- Mark as New
- Bookmark
- Subscribe
- Mute
- Subscribe to RSS Feed
- Permalink
- Report Inappropriate Content
Hi Karl,
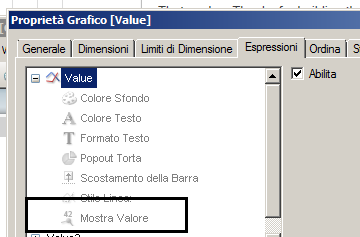
why don't use 'show value' in Expression -> + ?
Regards,
Antonio
- Mark as New
- Bookmark
- Subscribe
- Mute
- Subscribe to RSS Feed
- Permalink
- Report Inappropriate Content
As suggested just modify the already suggested formular, and use the Show Value expression.
- Mark as New
- Bookmark
- Subscribe
- Mute
- Subscribe to RSS Feed
- Permalink
- Report Inappropriate Content
Hi John / all
Please how can I display the last data point of the following expression?
=sum({1<Sale_Date={">=$(=Max(Sale_Date)-12)<=$(=Max(Sale_Date))"},Product={'Product 1'}>} Sales)/
Count({1<Sale_Date={">=$(=Max(Sale_Date)-12)<=$(=Max(Sale_Date))"},Product={'Product 1'}>} Sales)
Regards