Unlock a world of possibilities! Login now and discover the exclusive benefits awaiting you.
- Qlik Community
- :
- All Forums
- :
- QlikView App Dev
- :
- Re: reversing axes sign in scatter plot
- Subscribe to RSS Feed
- Mark Topic as New
- Mark Topic as Read
- Float this Topic for Current User
- Bookmark
- Subscribe
- Mute
- Printer Friendly Page
- Mark as New
- Bookmark
- Subscribe
- Mute
- Subscribe to RSS Feed
- Permalink
- Report Inappropriate Content
reversing axes sign in scatter plot
Hi,
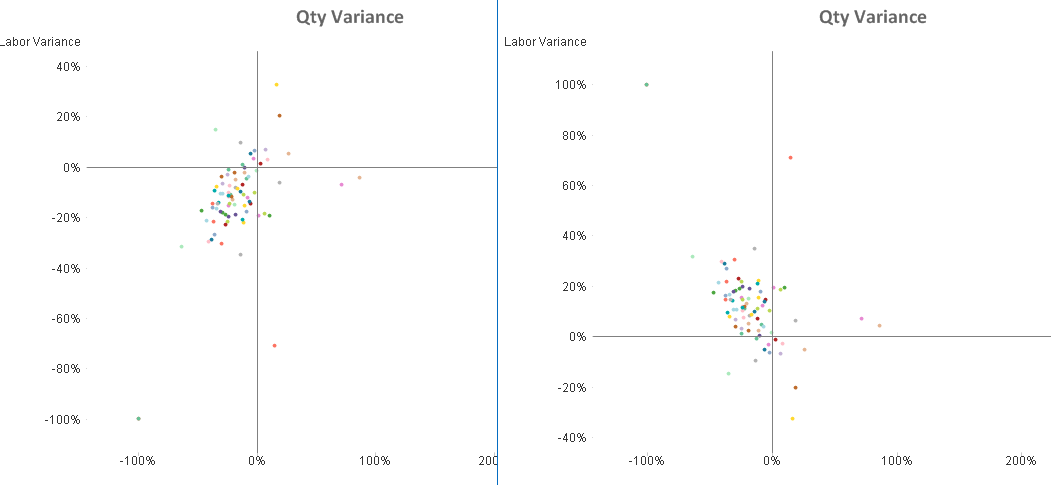
i have the below scatter plot and i want to change the Y axis and reverse it, so it i will have the center 0, below it are the positive values and above the negative values, now i was able to move the figures by simply multiplying the Y expression with -1 (chart on the left), however i am not able to change the axes numbers.
- Mark as New
- Bookmark
- Subscribe
- Mute
- Subscribe to RSS Feed
- Permalink
- Report Inappropriate Content
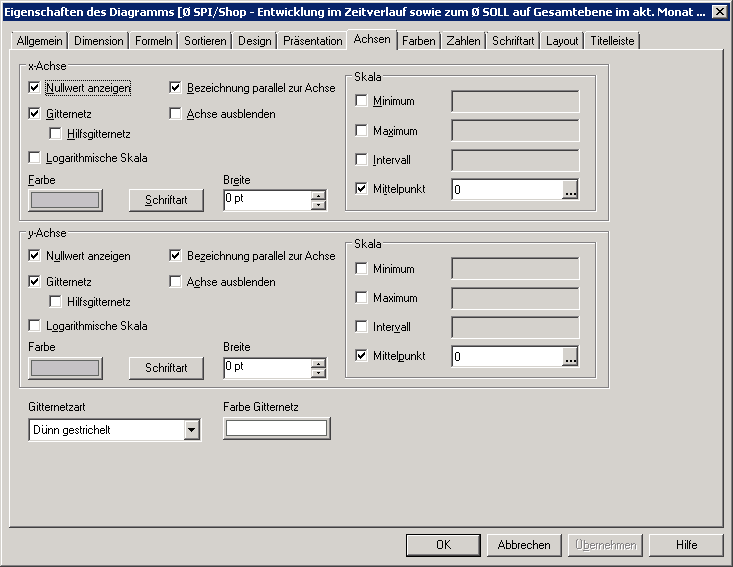
I think you will have to disable the automatic axe-scaling from qlikview be setting these manually - within the tab axes on the right side - there is an extra option for this.
- Marcus
- Mark as New
- Bookmark
- Subscribe
- Mute
- Subscribe to RSS Feed
- Permalink
- Report Inappropriate Content
tried it but it didn't work, any other ideas?
- Mark as New
- Bookmark
- Subscribe
- Mute
- Subscribe to RSS Feed
- Permalink
- Report Inappropriate Content
For me it worked how I have descriped it:
- Marcus
- Mark as New
- Bookmark
- Subscribe
- Mute
- Subscribe to RSS Feed
- Permalink
- Report Inappropriate Content
but how do you plot the axis values?
- Mark as New
- Bookmark
- Subscribe
- Mute
- Subscribe to RSS Feed
- Permalink
- Report Inappropriate Content
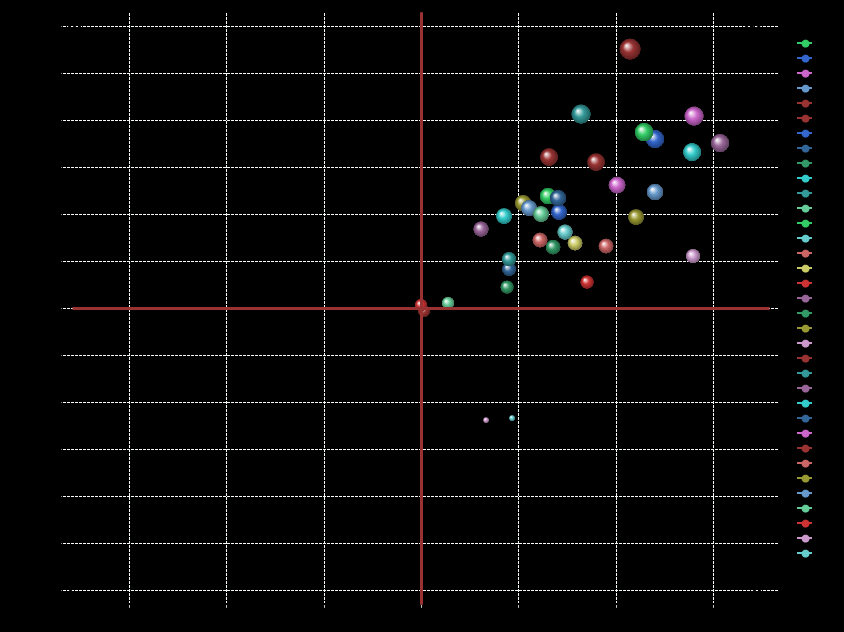
My axis are related to the average of the last (selectable) month and to the average budget overall. To build this isn't quite easy and will need some efforts. But I think this will be useful for you: Recipe for a Scatter Chart.
- Marcus