Unlock a world of possibilities! Login now and discover the exclusive benefits awaiting you.
- Qlik Community
- :
- All Forums
- :
- QlikView App Dev
- :
- Re: Rebuild a special chart
- Subscribe to RSS Feed
- Mark Topic as New
- Mark Topic as Read
- Float this Topic for Current User
- Bookmark
- Subscribe
- Mute
- Printer Friendly Page
- Mark as New
- Bookmark
- Subscribe
- Mute
- Subscribe to RSS Feed
- Permalink
- Report Inappropriate Content
Rebuild a special chart
Hi Community,
I need to build the following chart exactly or almost exactly within QlikView.
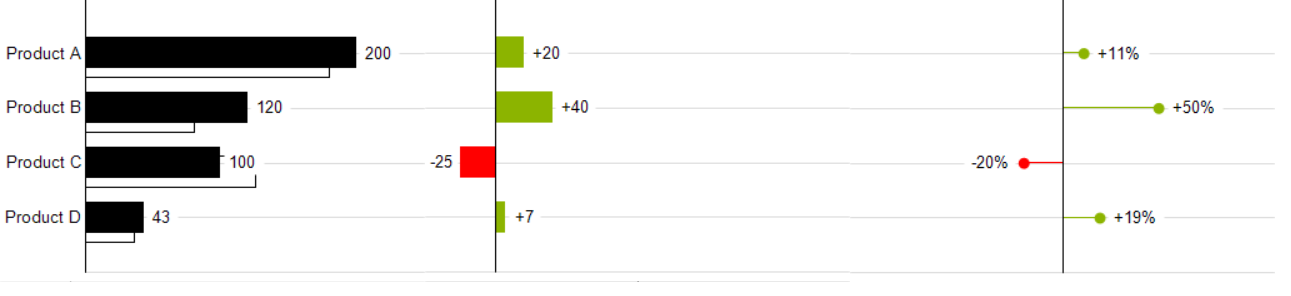
Especially the overlied bars and the "needle"-chart are my challenges at the moment.
Can anyone help me with my issue?
Thanks in advance.
Kind Regards
Christian
- Mark as New
- Bookmark
- Subscribe
- Mute
- Subscribe to RSS Feed
- Permalink
- Report Inappropriate Content
I think this is only possible with several charts which are overlapping each other. Within the settings you could hide many parts like axes, legends, borders ... from the chart or set the colors to transparent with argb(0,0,0,0). Further you could moving and resize chart-parts if the chart is active and you pressed the ctrl+shift key - then appear red lines which you could drag with the mouse.
- Marcus
- Mark as New
- Bookmark
- Subscribe
- Mute
- Subscribe to RSS Feed
- Permalink
- Report Inappropriate Content
Hello Marcus,
I know what you mean and I already have first results which you can see in the attached QVW.
Do you have a trick for the "needle"-chart (the right chart)?
-Christian
- Mark as New
- Bookmark
- Subscribe
- Mute
- Subscribe to RSS Feed
- Permalink
- Report Inappropriate Content
I think you are on a good way. Unfortunately there isn't an option to set the width of a bar so that you need two charts for the needle-presentation. One bar-chart with many bars which are set to = 0 which then reduce the width and one line-chart with points instead of the lines as presentation-typ.
To adjust all objects won't be easy and maybe you used better for the grid-lines another textobject with a picture under the charts or several lines as own objects.
- Marcus