Unlock a world of possibilities! Login now and discover the exclusive benefits awaiting you.
- Qlik Community
- :
- Forums
- :
- Analytics
- :
- New to Qlik Analytics
- :
- Re: 4 weeks data
- Subscribe to RSS Feed
- Mark Topic as New
- Mark Topic as Read
- Float this Topic for Current User
- Bookmark
- Subscribe
- Mute
- Printer Friendly Page
- Mark as New
- Bookmark
- Subscribe
- Mute
- Subscribe to RSS Feed
- Permalink
- Report Inappropriate Content
4 weeks data
Hi all,
I have attached the sample data.
I need bar graph on week basis, last 4 weeks data.
and also for last week. please help me.

Thanks,
Pramod
- « Previous Replies
-
- 1
- 2
- Next Replies »
Accepted Solutions
- Mark as New
- Bookmark
- Subscribe
- Mute
- Subscribe to RSS Feed
- Permalink
- Report Inappropriate Content
I right I forgot. Here's the script I used to create some date fields:
Data:
LOAD *,
week(date_created) as week,
weekstart(date_created) as weekstart,
weekyear(date_created) as year;
LOAD invitation_id,
date#(left(date_created,10),'YYYY-MM-DD') as date_created,
time#(mid(date_created,12,8),'hh:mm:ss') as time_created,
client_name,
course_completed,
user_signed
FROM [comm162892.csv] (txt, codepage is 1252, embedded labels, delimiter is ',', msq);
The field weekstart is used as chart dimension. To make sure to get the last four weeks including the selected week a set analysis expression is used to select the right date interval:
count({<weekstart={">$(=date(max(weekstart)-28))<=$(=max(weekstart))"}>}invitation_id)
I hope that gives you enough information to create the bar chart you need in Qlik Sense.
talk is cheap, supply exceeds demand
- Mark as New
- Bookmark
- Subscribe
- Mute
- Subscribe to RSS Feed
- Permalink
- Report Inappropriate Content
See attached example.
talk is cheap, supply exceeds demand
- Mark as New
- Bookmark
- Subscribe
- Mute
- Subscribe to RSS Feed
- Permalink
- Report Inappropriate Content
hi Gysbert Wassenaar,
can i know how to open this .Qvw file in qlik sense.
Thanks,
Pramod
- Mark as New
- Bookmark
- Subscribe
- Mute
- Subscribe to RSS Feed
- Permalink
- Report Inappropriate Content
I right I forgot. Here's the script I used to create some date fields:
Data:
LOAD *,
week(date_created) as week,
weekstart(date_created) as weekstart,
weekyear(date_created) as year;
LOAD invitation_id,
date#(left(date_created,10),'YYYY-MM-DD') as date_created,
time#(mid(date_created,12,8),'hh:mm:ss') as time_created,
client_name,
course_completed,
user_signed
FROM [comm162892.csv] (txt, codepage is 1252, embedded labels, delimiter is ',', msq);
The field weekstart is used as chart dimension. To make sure to get the last four weeks including the selected week a set analysis expression is used to select the right date interval:
count({<weekstart={">$(=date(max(weekstart)-28))<=$(=max(weekstart))"}>}invitation_id)
I hope that gives you enough information to create the bar chart you need in Qlik Sense.
talk is cheap, supply exceeds demand
- Mark as New
- Bookmark
- Subscribe
- Mute
- Subscribe to RSS Feed
- Permalink
- Report Inappropriate Content
Hi Gysbert Wassenaar,
If possible please send the .qvf file. it is helpful.
Thanks,
Pramod
- Mark as New
- Bookmark
- Subscribe
- Mute
- Subscribe to RSS Feed
- Permalink
- Report Inappropriate Content
Hi Gysbert Wassenaar,
Thanks a lot it's working fine.
Would you please tell me how to use for last one week data.
Thanks,
Pramod
- Mark as New
- Bookmark
- Subscribe
- Mute
- Subscribe to RSS Feed
- Permalink
- Report Inappropriate Content
I'll give you a hint  : 28 is the number of days in four weeks.
talk is cheap, supply exceeds demand
- Mark as New
- Bookmark
- Subscribe
- Mute
- Subscribe to RSS Feed
- Permalink
- Report Inappropriate Content
Hi Gysbert Wassenaar,
THANKS A LOT, one more doubt.
I need these values in %. please help.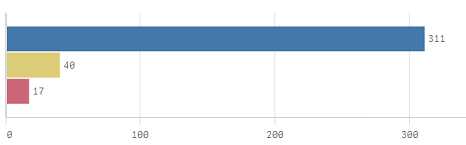
Like this,
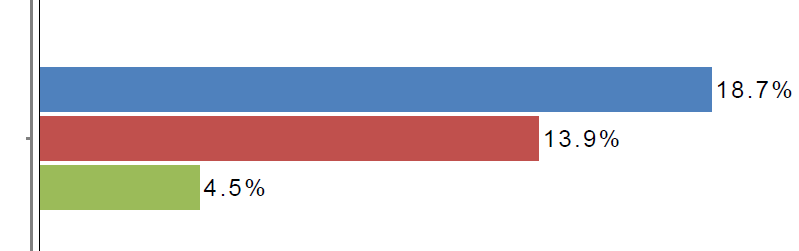
values varies in the above images.
Thanks,
Pramod
- Mark as New
- Bookmark
- Subscribe
- Mute
- Subscribe to RSS Feed
- Permalink
- Report Inappropriate Content
Ok, you have an expression something like count({...} value ). Change that into count({...} value ) / count(TOTAL {...} value )
talk is cheap, supply exceeds demand
- Mark as New
- Bookmark
- Subscribe
- Mute
- Subscribe to RSS Feed
- Permalink
- Report Inappropriate Content
hi,
i like sol
akansha
- « Previous Replies
-
- 1
- 2
- Next Replies »