Unlock a world of possibilities! Login now and discover the exclusive benefits awaiting you.
- Qlik Community
- :
- Forums
- :
- Analytics
- :
- New to Qlik Analytics
- :
- Re: Qlik sense charts-adding a trend line as a ref...
- Subscribe to RSS Feed
- Mark Topic as New
- Mark Topic as Read
- Float this Topic for Current User
- Bookmark
- Subscribe
- Mute
- Printer Friendly Page
- Mark as New
- Bookmark
- Subscribe
- Mute
- Subscribe to RSS Feed
- Permalink
- Report Inappropriate Content
Qlik sense charts-adding a trend line as a reference line
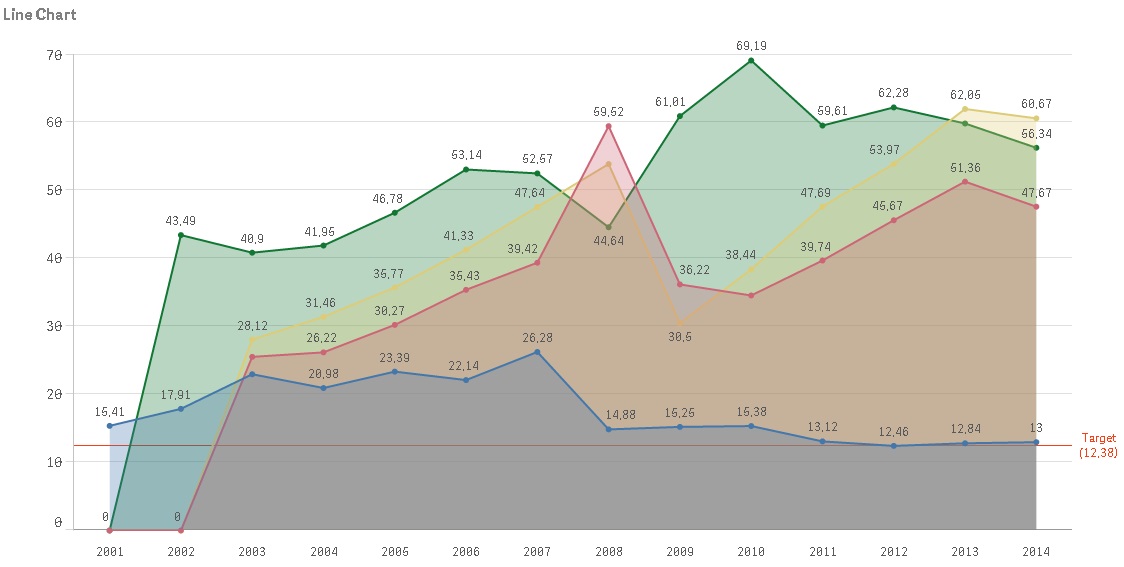
Please see attached chart - I would like to add a trend line similar to how the target line appears (i.e. without data points, but ideally red in colour and with a label) but I want to keep data points on my main measure. The formula below provides the trend line okay as a measure, but when I use the same as a reference line it doesn't appear?
linest_m(total aggr(if(avg(purple8mins),avg(purple8mins)),Mth),Mth)*
only({1}Mth)+linest_b(total aggr(if(avg(purple8mins),avg(purple8mins)),Mth),Mth)
Accepted Solutions
- Mark as New
- Bookmark
- Subscribe
- Mute
- Subscribe to RSS Feed
- Permalink
- Report Inappropriate Content
Hi Gus - you are correct - the reference line add-on fx expression - can be used to create a calculated, dynamic value to create a dynamic line as per the conditions defined in the expression. If you want to use a line as an actual trend line, you must use that formula you showed, as an expression in another measure.
I assume you got that example from here How to add lineal trend in Qlik sense or here: Re: How to add lineal trend in Qlik sense
Let me know if you have any other questions.
Please mark the appropriate replies as CORRECT / HELPFUL so our team and other members know that your question(s) has been answered to your satisfaction.
Regards,
Mike Tarallo
Qlik
Mike Tarallo
Qlik
- Mark as New
- Bookmark
- Subscribe
- Mute
- Subscribe to RSS Feed
- Permalink
- Report Inappropriate Content
Hi,
I did a similar Line Chart with my data in Qlik Sense and I went to "Add-ons" > "Reference lines". There you have the option to input your formula in the "Reference line expression" tab. Since I don't have your data, I couldn't insert your formlua, but I improvised with another one suitable for my data. After that you can choose a "Color" - red and a "Label" - Target:
The Target line won't have data points. However, to have your data points on your main line you have to go to "Appearance">"Presentation"> check "Show data points" and "Value labels".
I hope that I have been helpful.
- Mark as New
- Bookmark
- Subscribe
- Mute
- Subscribe to RSS Feed
- Permalink
- Report Inappropriate Content
thanks, yes I had manged to add a simple line (eg a target) as per the document attached in my post.
And I found the option for a specific colour and label - great!
That is why I also wanted to apply the formula on this post for a trend line - I got this from another post - but it shows there as a measure rather than a reference line.
Maybe the reference line option in add-ons is limited in this regard? but when I saw the fx option i thought there might be an option to add something more complex like a trend line?
cheers
- Mark as New
- Bookmark
- Subscribe
- Mute
- Subscribe to RSS Feed
- Permalink
- Report Inappropriate Content
Hi Gus - you are correct - the reference line add-on fx expression - can be used to create a calculated, dynamic value to create a dynamic line as per the conditions defined in the expression. If you want to use a line as an actual trend line, you must use that formula you showed, as an expression in another measure.
I assume you got that example from here How to add lineal trend in Qlik sense or here: Re: How to add lineal trend in Qlik sense
Let me know if you have any other questions.
Please mark the appropriate replies as CORRECT / HELPFUL so our team and other members know that your question(s) has been answered to your satisfaction.
Regards,
Mike Tarallo
Qlik
Mike Tarallo
Qlik
- Mark as New
- Bookmark
- Subscribe
- Mute
- Subscribe to RSS Feed
- Permalink
- Report Inappropriate Content
thanks for the clarification Michael - so I guess I'm after any suggestions for adding the trend line to a line chart, but distinguishing it by color with the data points removed (but left in for the main measure)? (i.e. referring to the attached doc on this post - the trend line is hard to separate out visually from the measure line)
- Mark as New
- Bookmark
- Subscribe
- Mute
- Subscribe to RSS Feed
- Permalink
- Report Inappropriate Content
Hello Gus,
Did you manage? Reading Michael's answer, i dont get it.
- Mark as New
- Bookmark
- Subscribe
- Mute
- Subscribe to RSS Feed
- Permalink
- Report Inappropriate Content
Hi,
I've successfully added a trend-line by using the suggested expression in a combo chart in Qlik Sense. But, when a time-frame is selected, the bars are filtered to the selected time-frame, but the trend line is not. I tried using a variable for the time period, but, it is quite possible I don't know what I'm doing since my only Qlik training has been searching to find a solution to a problem. Any suggestions? Does anyone know if the trend-line checkbox will ever be put into Qlik Sense as it was in Qlik View? It seems like folks have been asking for this for a while. Thanks so much for your help!
--Mel