Unlock a world of possibilities! Login now and discover the exclusive benefits awaiting you.
- Qlik Community
- :
- All Forums
- :
- QlikView App Dev
- :
- Help with Sales vs Forecast
- Subscribe to RSS Feed
- Mark Topic as New
- Mark Topic as Read
- Float this Topic for Current User
- Bookmark
- Subscribe
- Mute
- Printer Friendly Page
- Mark as New
- Bookmark
- Subscribe
- Mute
- Subscribe to RSS Feed
- Permalink
- Report Inappropriate Content
Help with Sales vs Forecast
Hello guys
I'm trying to figure out a way to compare my monthly sales with the forecasted value for each month.
I'm getting this circle problem attached (I've cutted other columns to simplify)
Appreciate your help.
- Tags:
- qlikview_scripting
Accepted Solutions
- Mark as New
- Bookmark
- Subscribe
- Mute
- Subscribe to RSS Feed
- Permalink
- Report Inappropriate Content
- Mark as New
- Bookmark
- Subscribe
- Mute
- Subscribe to RSS Feed
- Permalink
- Report Inappropriate Content
Question number one - do you need Product level granularity in Sales? If not, there is an easy solution - replace Product with Product Group in Sales, and concatenate Sales and Forecast into one facts table.
If you need Product level in Sales, it will be a more complex solution, probably using a link table in the data model.
- Mark as New
- Bookmark
- Subscribe
- Mute
- Subscribe to RSS Feed
- Permalink
- Report Inappropriate Content
Dear Michael, thank you for your kindly answer. Could you guide me thru that?
I don't see how can I concatenate my Group Sales into a New Table.
- Mark as New
- Bookmark
- Subscribe
- Mute
- Subscribe to RSS Feed
- Permalink
- Report Inappropriate Content
Assuming you have resident tables as on our screenshot, here is how you can do it:
ProductGroupMap:
MAPPING LOAD DISTINCT
Product as A,
"Group of Product" as B
RESIDENT ProductTable;
CONCATENATE (Forecast) LOAD
applymap('ProductGroupMap',Product) as "Group of Product", // this replaces Product with the Group of Products
Month,
Sales,
Date
RESIDENT Sales;
As a result, you get one table named Forecast with the both Forecast and Sales data.
Reminder - in this case you don't have Sales on the Product level anymore.
- Mark as New
- Bookmark
- Subscribe
- Mute
- Subscribe to RSS Feed
- Permalink
- Report Inappropriate Content
Hi Michael,
So that's what I've got:
LOAD Product,
Sales,
Date,
Month(Date) as Month
FROM
(ooxml, embedded labels, table is Sales);
LOAD Product,
[Group of Product]
FROM
(ooxml, embedded labels, table is ProductTable);
LOAD [Group of Product],
Month,
[Monthly Forecast by Group]
FROM
(ooxml, embedded labels, table is Forecast);
ProductGroupMap:
MAPPING LOAD DISTINCT
Product as A,
[Group of Product] as B
RESIDENT ProductTable;
CONCATENATE (Forecast) LOAD
applymap('ProductGroupMap',Product) as [Group of Product],
Month,
Sales,
Date
RESIDENT Sales;
And I'm still getting this updated circle problem: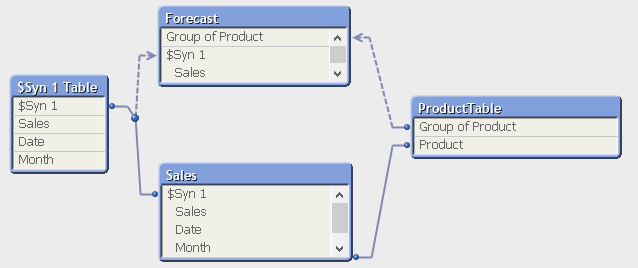
Appreciate your help,
- Mark as New
- Bookmark
- Subscribe
- Mute
- Subscribe to RSS Feed
- Permalink
- Report Inappropriate Content
You have to drop the Sales table at the end:
DROP TABLE Sales;
- Mark as New
- Bookmark
- Subscribe
- Mute
- Subscribe to RSS Feed
- Permalink
- Report Inappropriate Content
Yeah. You got it.
Thanks mate.