Unlock a world of possibilities! Login now and discover the exclusive benefits awaiting you.
- Qlik Community
- :
- All Forums
- :
- QlikView App Dev
- :
- Re: Trellis chart with conditional color
- Subscribe to RSS Feed
- Mark Topic as New
- Mark Topic as Read
- Float this Topic for Current User
- Bookmark
- Subscribe
- Mute
- Printer Friendly Page
- Mark as New
- Bookmark
- Subscribe
- Mute
- Subscribe to RSS Feed
- Permalink
- Report Inappropriate Content
Trellis chart with conditional color
Hi guys!
I have been working in a trellis chart. But I am having an issue with the conditional colour. My goal is to specify a logic that applies a different color to each chart according to results of their expressions.
I tried using aggr function in the background color and in the presentation tab, but it seems that qlikview does the calculation before and apply the same colour to every chart in the trellis.
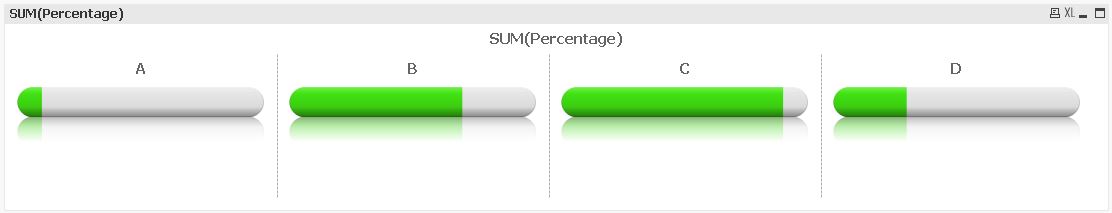
In the exemple above I was hoping to get red color for the lower values.
Does someone know if what I want is possible to achieve?
Best Regards!
- Mark as New
- Bookmark
- Subscribe
- Mute
- Subscribe to RSS Feed
- Permalink
- Report Inappropriate Content
Not afaik. You can either use four separate charts or use two segments:

talk is cheap, supply exceeds demand
- Mark as New
- Bookmark
- Subscribe
- Mute
- Subscribe to RSS Feed
- Permalink
- Report Inappropriate Content
Thank you for your answer, Gysbert.
I will have to use the trellis feature because the number of charts can change depending on the data.
If someone knows a workaround, please let me know. I would like to have something like the fake image below
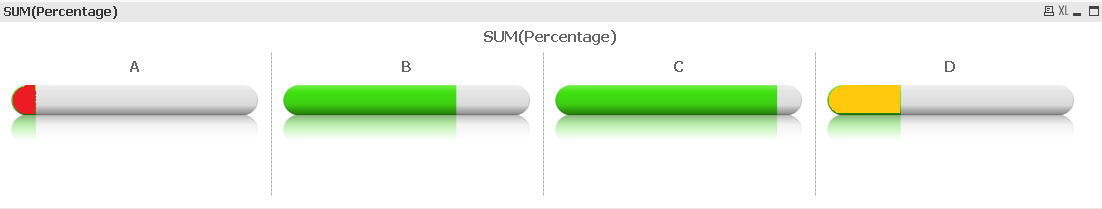
Thanks again