Unlock a world of possibilities! Login now and discover the exclusive benefits awaiting you.
- Qlik Community
- :
- All Forums
- :
- QlikView App Dev
- :
- Re: I wanna show the axis value as date in below m...
- Subscribe to RSS Feed
- Mark Topic as New
- Mark Topic as Read
- Float this Topic for Current User
- Bookmark
- Subscribe
- Mute
- Printer Friendly Page
- Mark as New
- Bookmark
- Subscribe
- Mute
- Subscribe to RSS Feed
- Permalink
- Report Inappropriate Content
I wanna show the axis value as date in below manner
Hi friends
I wanna show the axis value as date in below manner. In that picture u can see the range of values 0-29 like that. I need to show the date like as that manner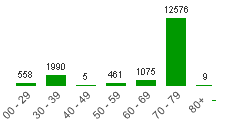
- « Previous Replies
-
- 1
- 2
- Next Replies »
Accepted Solutions
- Mark as New
- Bookmark
- Subscribe
- Mute
- Subscribe to RSS Feed
- Permalink
- Report Inappropriate Content
Hi,
If you want to bend your dimension value.
then go to presentaion ->Axis->Dimesion Axes->Primary Dimension Labels->Select Radio Button
Regards
Please appreciate our Qlik community members by giving Kudos for sharing their time for your query. If your query is answered, please mark the topic as resolved 🙂
- Mark as New
- Bookmark
- Subscribe
- Mute
- Subscribe to RSS Feed
- Permalink
- Report Inappropriate Content
Hi Abinesh,
Try with Replace() and Class() functions.
Can you please post the existed x-axis format so that we will try to implement it?
Thanks & Regards,
Harsha Nandan.
- Mark as New
- Bookmark
- Subscribe
- Mute
- Subscribe to RSS Feed
- Permalink
- Report Inappropriate Content
Hi,
Create Bucket in script then use that field as dimension.
For better understanding read article on Bucket written by Henric
Regards
Please appreciate our Qlik community members by giving Kudos for sharing their time for your query. If your query is answered, please mark the topic as resolved 🙂
- Mark as New
- Bookmark
- Subscribe
- Mute
- Subscribe to RSS Feed
- Permalink
- Report Inappropriate Content
I would consider using IntervalMatch and pre-group the values during load.
- Mark as New
- Bookmark
- Subscribe
- Mute
- Subscribe to RSS Feed
- Permalink
- Report Inappropriate Content
Abinesh,
Try this:
load distinct
*,
dual(if(TicketAge >=0 and TicketAge <= 7, '0-7 days',
if(TicketAge >=8 and TicketAge <= 14, '8-14 days',
if(TicketAge >=15 and TicketAge <= 21, '15-21 days',
if(TicketAge >=22 and TicketAge <= 28, '22-28 days',
if(TicketAge >=29 and TicketAge <= 60, '29-60 days',
if(TicketAge >=61 and TicketAge <= 90, '61-90 days',
if(TicketAge >=91 and TicketAge <= 120, '91-120 days',
if(TicketAge >121, 'Above 121 days')))))))),
if(TicketAge >=0 and TicketAge <= 7, 10,
if(TicketAge >=7 and TicketAge <= 14, 20,
if(TicketAge >=15 and TicketAge <= 21, 30,
if(TicketAge >=22 and TicketAge <= 28, 40,
if(TicketAge >=29 and TicketAge <= 60, 50,
if(TicketAge >=61 and TicketAge <= 90, 60,
if(TicketAge >=91 and TicketAge <= 120, 70,
if(TicketAge >121, 80))))))))
) as TicketAgeGroup,
Thanks,
AS
- Mark as New
- Bookmark
- Subscribe
- Mute
- Subscribe to RSS Feed
- Permalink
- Report Inappropriate Content
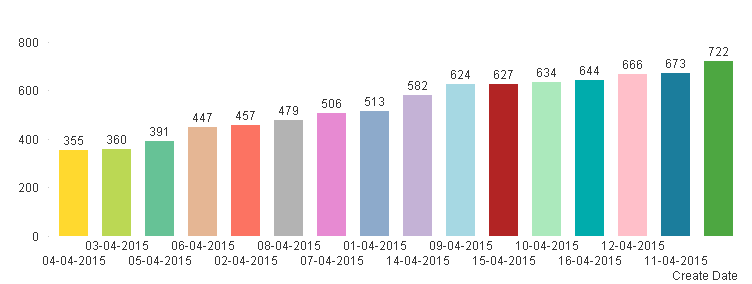
Harsha Thank you for your resp I attached the existing bar chart in that I wanna show the date as the above bar chart
- Mark as New
- Bookmark
- Subscribe
- Mute
- Subscribe to RSS Feed
- Permalink
- Report Inappropriate Content
You mention that the X-axis should be 0-29. What does this range mean? Does it represent the age, and number of days from today?
You will probably get a more precise answer if you attach a sample QVW.
- Mark as New
- Bookmark
- Subscribe
- Mute
- Subscribe to RSS Feed
- Permalink
- Report Inappropriate Content
Bro I 2nd one is my chart 1st one is for reference I just wanna to show the date in my chart like as range in first chart "Slightly bend in vertical direction". That's my question
- Mark as New
- Bookmark
- Subscribe
- Mute
- Subscribe to RSS Feed
- Permalink
- Report Inappropriate Content
Hi,
If you want to bend your dimension value.
then go to presentaion ->Axis->Dimesion Axes->Primary Dimension Labels->Select Radio Button
Regards
Please appreciate our Qlik community members by giving Kudos for sharing their time for your query. If your query is answered, please mark the topic as resolved 🙂
- Mark as New
- Bookmark
- Subscribe
- Mute
- Subscribe to RSS Feed
- Permalink
- Report Inappropriate Content
Thank you bro.
- « Previous Replies
-
- 1
- 2
- Next Replies »