Unlock a world of possibilities! Login now and discover the exclusive benefits awaiting you.
- Qlik Community
- :
- Forums
- :
- Analytics
- :
- New to Qlik Analytics
- :
- Show values on both right & left position of y axi...
- Subscribe to RSS Feed
- Mark Topic as New
- Mark Topic as Read
- Float this Topic for Current User
- Bookmark
- Subscribe
- Mute
- Printer Friendly Page
- Mark as New
- Bookmark
- Subscribe
- Mute
- Subscribe to RSS Feed
- Permalink
- Report Inappropriate Content
Show values on both right & left position of y axis
Hi,
I'm trying to achieve the below result and have completed some part of it but really need help in some of the points where I'm stuck.
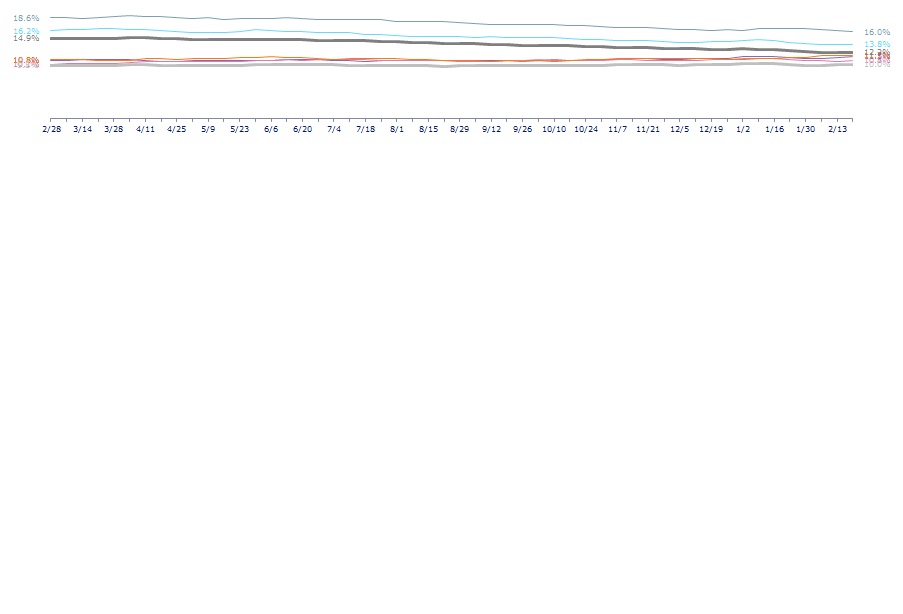
Below image has each line representing the sales of the particular product on that particular date.
Now what is my challenge here is to show the sales percentages values on both right and left position of y axis.
Thanks in advance!!
- Mark as New
- Bookmark
- Subscribe
- Mute
- Subscribe to RSS Feed
- Permalink
- Report Inappropriate Content
Hi, I dont know whethere any direct way to do this. You can create same chart twice. Make them one overlay other and change the transparency of one of the chart. In one chart you can make the axes as left(do this on Axes Tab of chart properties) and for another chart make the axes on the right. You can try. I'm not sure on this.
- Mark as New
- Bookmark
- Subscribe
- Mute
- Subscribe to RSS Feed
- Permalink
- Report Inappropriate Content
Hi,
the only way to achieve this is to build an extension using d3.js or other JavaScript data visualization library.
- Ralf
- Mark as New
- Bookmark
- Subscribe
- Mute
- Subscribe to RSS Feed
- Permalink
- Report Inappropriate Content
Thanks for the reply but I have tried creating the two identical expressions and selecting the position one of it as right but data came over was not correct..
- Mark as New
- Bookmark
- Subscribe
- Mute
- Subscribe to RSS Feed
- Permalink
- Report Inappropriate Content
Thanks for the reply but can this is achievable at without using JS ??
- Mark as New
- Bookmark
- Subscribe
- Mute
- Subscribe to RSS Feed
- Permalink
- Report Inappropriate Content
Hi BI User,
it's a rather basic example, line chart has a second expression based on the highest and lowest dates and same basic expression as the main expression no line just show values on data points!

- Mark as New
- Bookmark
- Subscribe
- Mute
- Subscribe to RSS Feed
- Permalink
- Report Inappropriate Content
Hi ,
I have tried creating two expressions, one is the main expression and the other one is based on the conditional max and min date sales values .I have also checked the property 'values on data points ' for the 2nd expression only but its still displaying data on all the data points than on the first and last point.
I need help on this as I'm unable to understand what I'm missing on this.
Thanks!!
- Mark as New
- Bookmark
- Subscribe
- Mute
- Subscribe to RSS Feed
- Permalink
- Report Inappropriate Content
Hi All,
I have tried using two expressions exp1:Sum(sales)
exp 2:if((shpDate= date(min(shpDate)) )or( shpDate=date(max(shpDate))),exp1,'---')(checked the property 'values on data points ' and unchecked line for exp2 )
and achieved the below result but I need sales values for only max and min dates of each product
These lines will represent the sales for different products for the particular date. Also Max & min date for each product will vary
I'm new to qlikview so may have missed something...Any Help on this will be appreciable..

Thanks in advance!!