Unlock a world of possibilities! Login now and discover the exclusive benefits awaiting you.
- Qlik Community
- :
- Forums
- :
- Analytics
- :
- New to Qlik Analytics
- :
- Re: Positive and Negative Values on Bar chart
- Subscribe to RSS Feed
- Mark Topic as New
- Mark Topic as Read
- Float this Topic for Current User
- Bookmark
- Subscribe
- Mute
- Printer Friendly Page
- Mark as New
- Bookmark
- Subscribe
- Mute
- Subscribe to RSS Feed
- Permalink
- Report Inappropriate Content
Positive and Negative Values on Bar chart
Hi mto,
I have Database of Icecream Industry.
i'll show positive and negative values of temperature on Bar chart in Qlik sense.
I have
a) Created Date (e.g. 01/01/2015, 01/02015, 01/03/2015)
b)Temperature ( it contains positive and Negative Values e.g. -23,-24,-25,30,31,17)
but when i add those in Bar chart, it shows negative values below X axis and Positive values up on the X axis.with respect to Created Date. But requirement is to show negative values up on the X-axis. How can it possible in Qlik sense1.1.
suppose i want to show only negative values but up on the X-axis. how it would be happen?
also requirement for both positive and negative values so how can it possible in Bar chart two show those values in good way?
or is it any another Chart which suits for such type of data?
Accepted Solutions
- Mark as New
- Bookmark
- Subscribe
- Mute
- Subscribe to RSS Feed
- Permalink
- Report Inappropriate Content
Hi Satish,
with FABS(expression) you can bring the neg. values on the upper half of the x-axis (together with the pos. values).
The problem is to get the minus sign in front of this values, because you can't enter an expression in the format pattern field etc.
The only way to bring both together would be to create two measures (one for pos & one for neg values) but also means that pos. & neg. bars are slightly offset & in the popup label both measures are visible.
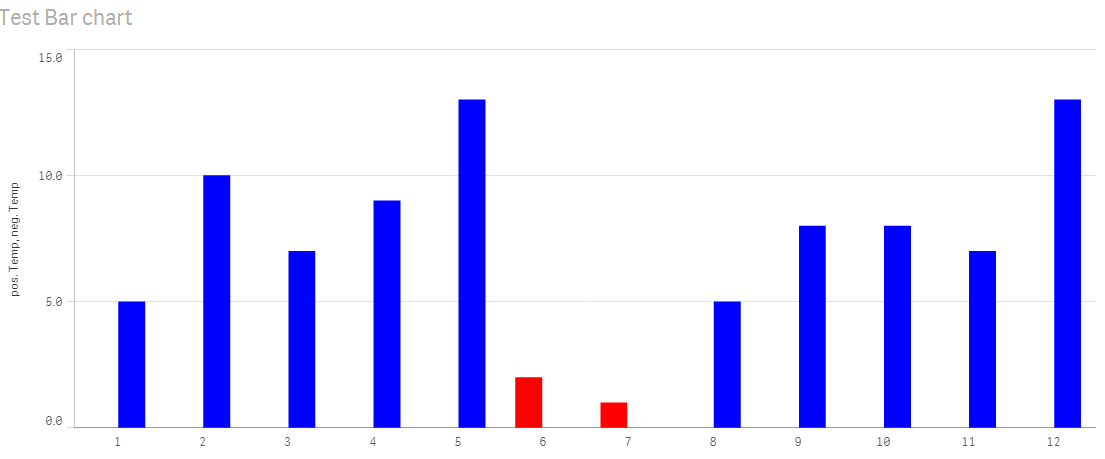
blue= neg. values (incl. "-" in the popup label)
red= pos values
I am not sure if there is better solution to achieve what you need at the moment in QSense.
Regards,
Ronny
- Mark as New
- Bookmark
- Subscribe
- Mute
- Subscribe to RSS Feed
- Permalink
- Report Inappropriate Content
i loaded some data in the load editor as follows:
load * inline [
CreatedDate,Temperatur
1/1/2015,-20
2/1/2015,-10
3/1/2015,-5
4/1/2015,5
5/1/2015,10
6/1/2015,20
];
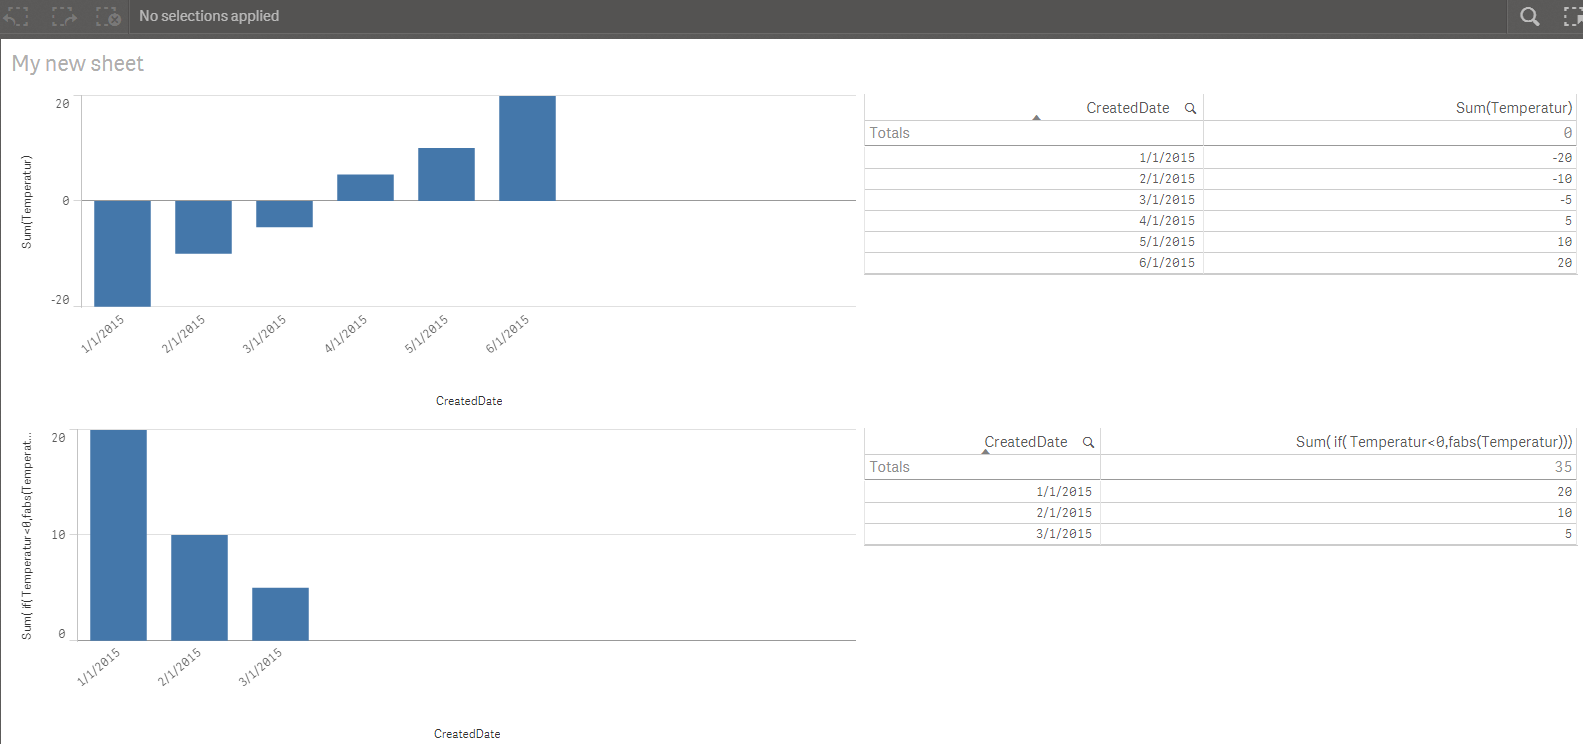
And was able to get the desired output using the following calculated dimension and measure:
Dimension: if( aggr(sum(Temperatur),CreatedDate) < 0 ,CreatedDate)
...ensuring 'show null values' is unchecked
Measure: Sum( if( Temperatur<0,fabs(Temperatur)))
The chart and table on the top row below is the native data.
The 2nd row has just the negatives showing as positives.
- Mark as New
- Bookmark
- Subscribe
- Mute
- Subscribe to RSS Feed
- Permalink
- Report Inappropriate Content
Hi,
But if i only want to show negative values up on the X-axis. with their Minus(-) sign.
Is it possible?
How can we show axes with negative scale up on the X-axis in Qlik sense.?
i have multiple positive, Negative and zero values also.
- Mark as New
- Bookmark
- Subscribe
- Mute
- Subscribe to RSS Feed
- Permalink
- Report Inappropriate Content
Hi Satish,
with FABS(expression) you can bring the neg. values on the upper half of the x-axis (together with the pos. values).
The problem is to get the minus sign in front of this values, because you can't enter an expression in the format pattern field etc.
The only way to bring both together would be to create two measures (one for pos & one for neg values) but also means that pos. & neg. bars are slightly offset & in the popup label both measures are visible.
blue= neg. values (incl. "-" in the popup label)
red= pos values
I am not sure if there is better solution to achieve what you need at the moment in QSense.
Regards,
Ronny
- Mark as New
- Bookmark
- Subscribe
- Mute
- Subscribe to RSS Feed
- Permalink
- Report Inappropriate Content
How can I Eliminate zero Temperature values from Chart?
Have any way to do it?
- Mark as New
- Bookmark
- Subscribe
- Mute
- Subscribe to RSS Feed
- Permalink
- Report Inappropriate Content
Hi Satish,
e.g. 1 only has a neg. value and also a 0 value for second expression (pos. temperature).
As soon one of the two expressions has a value <>0 , both will be displayed on the graph.
You can't eliminate the zero value of just one of the expressions. both or non.
I think there is not a hundred percent solution for your requirements at the moment in Qlik Sense.
1) You can achieve only 1 bar per dimension value, if you can replace "-"sign by color, etc.
2) You can achieve "-" for neg. values in popup label but then you have 2 bars per dimension value (single zero value can't be eliminate)
Regards
Ronny