Unlock a world of possibilities! Login now and discover the exclusive benefits awaiting you.
- Qlik Community
- :
- All Forums
- :
- QlikView App Dev
- :
- Re: Compare values in Rolling Quarter
- Subscribe to RSS Feed
- Mark Topic as New
- Mark Topic as Read
- Float this Topic for Current User
- Bookmark
- Subscribe
- Mute
- Printer Friendly Page
- Mark as New
- Bookmark
- Subscribe
- Mute
- Subscribe to RSS Feed
- Permalink
- Report Inappropriate Content
Compare values in Rolling Quarter
Hi, I'm not very experienced in QlikView and I need help to create a pivot table like this
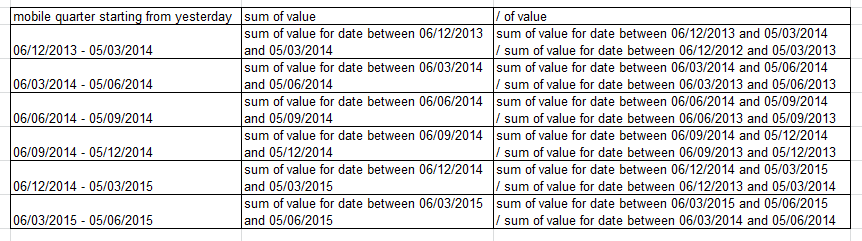
from a excel file as one attached
Can someone help me?
thanks
Accepted Solutions
- Mark as New
- Bookmark
- Subscribe
- Mute
- Subscribe to RSS Feed
- Permalink
- Report Inappropriate Content
I don't this will work as required:
a) there is no definition of quarter as required (rolling 3 months back from yesterday)
b) accessing the dimension value of quarter in the set modifier will not work, a set expression is evaluated in global context
Try like this:
DATA:
LOAD Date,
     Value
FROM

(biff, embedded labels, table is [Foglio1$]);


Extrema:
LOAD
min(Date) as Min,
max(Date) as Max
Resident DATA;


Let vMinDate = Peek('Min',0,'Extrema');
Let vMaxDate = Peek('Max',0,'Extrema');
Let vNumIntervals = ceil((today() - vMinDate) / 30.5);


drop table Extrema;


Intervals:
JOIN (DATA) IntervalMatch (Date) LOAD
AddMonths(today(),-(recno()*3)) as StartDate,
AddMonths((today()-1),-(recno()-1)*3) as EndDate
AutoGenerate $(vNumIntervals);


RESULT:
LOAD *,
  dual(Date(StartDate) & ' - ' & Date(EndDate),StartDate) as RollingQuarter
Resident DATA;


drop table DATA;
And in the UI a chart with dimension RollingQuarter and expressions like
=sum(Value)
=above(sum(Value),4)
=column(1) / column(2)
- Mark as New
- Bookmark
- Subscribe
- Mute
- Subscribe to RSS Feed
- Permalink
- Report Inappropriate Content
while loading time u have to create quarter field based on datefield;;;'Q' & ceil(datefield/3) as quarter,
in chart dim-->quarter
expression-->sum({<quarter={'$(=quarter-1)'}>}value)
- Mark as New
- Bookmark
- Subscribe
- Mute
- Subscribe to RSS Feed
- Permalink
- Report Inappropriate Content
I don't this will work as required:
a) there is no definition of quarter as required (rolling 3 months back from yesterday)
b) accessing the dimension value of quarter in the set modifier will not work, a set expression is evaluated in global context
Try like this:
DATA:
LOAD Date,
     Value
FROM

(biff, embedded labels, table is [Foglio1$]);


Extrema:
LOAD
min(Date) as Min,
max(Date) as Max
Resident DATA;


Let vMinDate = Peek('Min',0,'Extrema');
Let vMaxDate = Peek('Max',0,'Extrema');
Let vNumIntervals = ceil((today() - vMinDate) / 30.5);


drop table Extrema;


Intervals:
JOIN (DATA) IntervalMatch (Date) LOAD
AddMonths(today(),-(recno()*3)) as StartDate,
AddMonths((today()-1),-(recno()-1)*3) as EndDate
AutoGenerate $(vNumIntervals);


RESULT:
LOAD *,
  dual(Date(StartDate) & ' - ' & Date(EndDate),StartDate) as RollingQuarter
Resident DATA;


drop table DATA;
And in the UI a chart with dimension RollingQuarter and expressions like
=sum(Value)
=above(sum(Value),4)
=column(1) / column(2)
- Mark as New
- Bookmark
- Subscribe
- Mute
- Subscribe to RSS Feed
- Permalink
- Report Inappropriate Content
Please check attached QVW & let me know if your query is resolved. 
- Mark as New
- Bookmark
- Subscribe
- Mute
- Subscribe to RSS Feed
- Permalink
- Report Inappropriate Content
It is exactly what I needed
Thanks
- Mark as New
- Bookmark
- Subscribe
- Mute
- Subscribe to RSS Feed
- Permalink
- Report Inappropriate Content
This is another interesting solution, but for my needs I use the Swuehl 's solution
Thanks