Unlock a world of possibilities! Login now and discover the exclusive benefits awaiting you.
- Qlik Community
- :
- All Forums
- :
- QlikView App Dev
- :
- Re: converting zeros formed by expressions into '-...
- Subscribe to RSS Feed
- Mark Topic as New
- Mark Topic as Read
- Float this Topic for Current User
- Bookmark
- Subscribe
- Mute
- Printer Friendly Page
- Mark as New
- Bookmark
- Subscribe
- Mute
- Subscribe to RSS Feed
- Permalink
- Report Inappropriate Content
converting zeros formed by expressions into '-' and changing the background color to grey
Hi
I have a data coming from a database which are related to the particular regions where some regions do not have number at all and are represented as null but while using this as an expression on the view they are shown as zero as in an expression sum(null) or avg(null) are shown as zero. In the same way I have some zeros also coming in database which when summed are also shown as zero's in view. I am not able to differentiate between both zero's. I want to show the zero's caused by null as '-' and background greyed out and the zero's caused by actual zero's as it is.
thanks in advance
hemantha
- Tags:
- qlikview_scripting
- Mark as New
- Bookmark
- Subscribe
- Mute
- Subscribe to RSS Feed
- Permalink
- Report Inappropriate Content
- Mark as New
- Bookmark
- Subscribe
- Mute
- Subscribe to RSS Feed
- Permalink
- Report Inappropriate Content
Hi,
one solution could be:
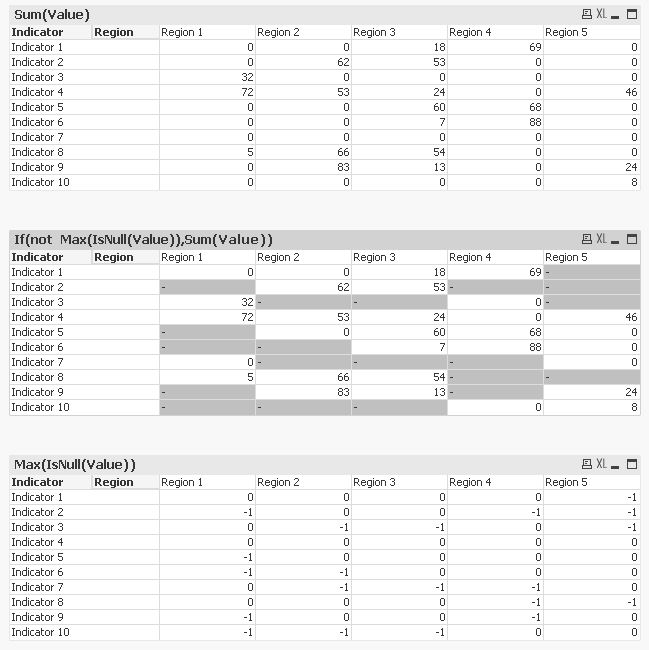
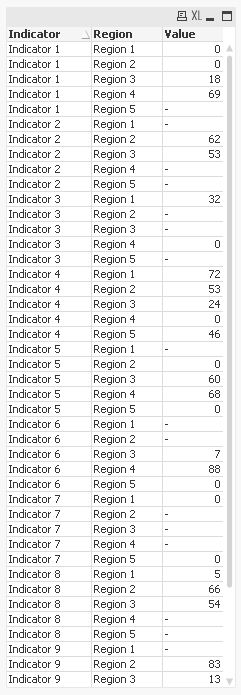
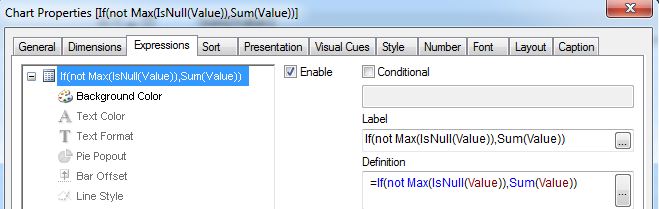
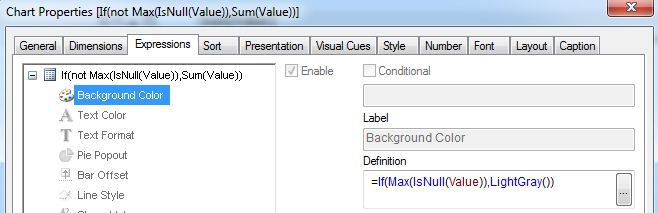
table1:
LOAD 'Region '&RecNo() as Region,
    'Indicator '&IterNo() as Indicator,
    Pick(Ceil(Rand()*3),0,Ceil(Rand()*100)) as Value
AutoGenerate 5
While IterNo() <= 10;
hope this helps
regards
Marco
- Mark as New
- Bookmark
- Subscribe
- Mute
- Subscribe to RSS Feed
- Permalink
- Report Inappropriate Content
The indicator which you are showing is not the only dimension I am having in the view and though the dimension consists of lower level fact id's which are actually null. So the dimension is a group of different fact_id's which are null in the database. And also there are not only region expressions in the view, there are expressions like total,prior,Prior week change%,12 week avg etc. So the zeros are not only causing due to region cut but also due to so many expressions divided.I want to find out among all these those zeros which are caused by the fact_id nulls in the database and grey them out.
Thanks in Advance.
Hemantha
- Mark as New
- Bookmark
- Subscribe
- Mute
- Subscribe to RSS Feed
- Permalink
- Report Inappropriate Content
Please post a sample application and your expected result.
thanks
regards
Marco