Unlock a world of possibilities! Login now and discover the exclusive benefits awaiting you.
- Qlik Community
- :
- All Forums
- :
- QlikView App Dev
- :
- Re: Chart layout
- Subscribe to RSS Feed
- Mark Topic as New
- Mark Topic as Read
- Float this Topic for Current User
- Bookmark
- Subscribe
- Mute
- Printer Friendly Page
- Mark as New
- Bookmark
- Subscribe
- Mute
- Subscribe to RSS Feed
- Permalink
- Report Inappropriate Content
Chart layout
HI, i have created some chart , but I don't like so much it.
There are too space where not it need, please see the example.
I tried with ctrl+shift to enlarge the chart part, but it not work so well.
It compress the chart, instead to make it larger.
Please , Where I am wrong?
- Mark as New
- Bookmark
- Subscribe
- Mute
- Subscribe to RSS Feed
- Permalink
- Report Inappropriate Content
Hi Farfalla,
can you upload your qvw please?
Andy
- Mark as New
- Bookmark
- Subscribe
- Mute
- Subscribe to RSS Feed
- Permalink
- Report Inappropriate Content
Drag your legend to bottom by holding Ctrl+Shift and enable Chart scrolling : Chart Properties > Presentation > Chart scrolling > Enable x-Axis scroll bar to 8 or 10.
- Mark as New
- Bookmark
- Subscribe
- Mute
- Subscribe to RSS Feed
- Permalink
- Report Inappropriate Content
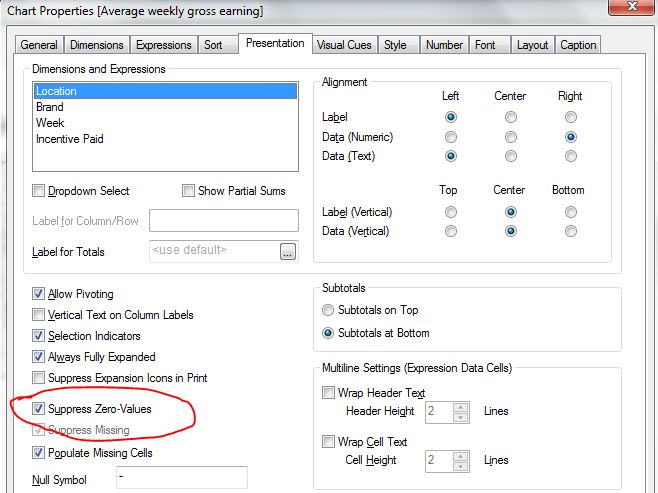
I think you will need several steps: surpress NULL in dimensions and expression, enabling dimension-scroll like suggested above, use a horizontal legend: Horizontal Legend in chart and maybe some more.
- Marcus
- Mark as New
- Bookmark
- Subscribe
- Mute
- Subscribe to RSS Feed
- Permalink
- Report Inappropriate Content
Thank for your reply. What do you mean with surpress NULL in dimensions and expression?
thanks
- Mark as New
- Bookmark
- Subscribe
- Mute
- Subscribe to RSS Feed
- Permalink
- Report Inappropriate Content
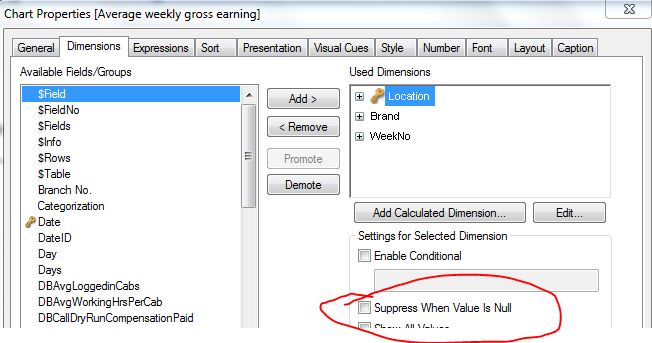
Within the tab dimension you could for each dimension set different options like "Hide Null", "Show All" and within the tab presentation is a global option to hide NULL or missing values in expressions.
I'm not sure if this is relevant for the space below and above the bars but it should be worth an attempt. You could also export the chart to excel to see which content will be displayed for the space.
- Marcus
- Mark as New
- Bookmark
- Subscribe
- Mute
- Subscribe to RSS Feed
- Permalink
- Report Inappropriate Content
Marcus mean to say below steps