Unlock a world of possibilities! Login now and discover the exclusive benefits awaiting you.
- Qlik Community
- :
- All Forums
- :
- QlikView App Dev
- :
- Re: How to display dynamic straight table ?
- Subscribe to RSS Feed
- Mark Topic as New
- Mark Topic as Read
- Float this Topic for Current User
- Bookmark
- Subscribe
- Mute
- Printer Friendly Page
- Mark as New
- Bookmark
- Subscribe
- Mute
- Subscribe to RSS Feed
- Permalink
- Report Inappropriate Content
How to display dynamic straight table ?
Hi,
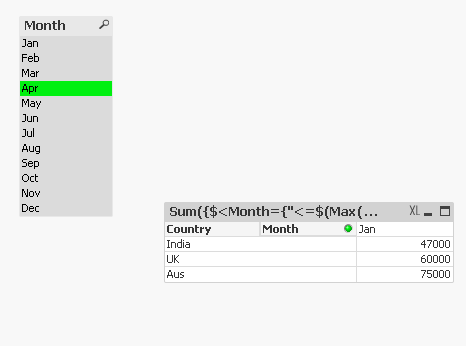
I create straight table in qlikview . I want to display my straight table dynamically according to my selections. like this
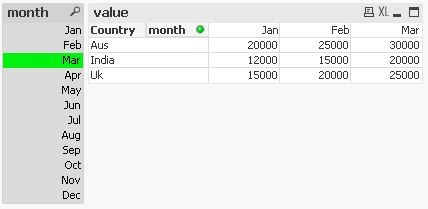
If I select march then display my straight table Jan feb mar.like below.
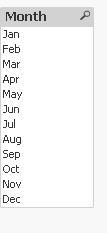
| Listbox |
|---|
| Jan |
| Feb |
| Mar |
| apr |
| may |
| jun |
Straight table.
| Country | Jan | Feb | mar |
|---|---|---|---|
| India | 12000 | 15000 | 20000 |
| Uk | 15000 | 20000 | 25000 |
| Aus | 20000 | 25000 | 30000 |
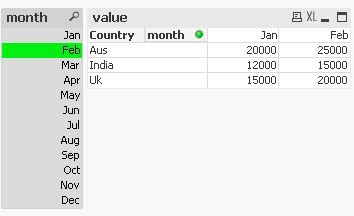
If I select Feb then display Like this :it show only jan and feb .
| country | Jan | Feb |
|---|---|---|
| India | 12000 | 15000 |
| Uk | 15000 | 20000 |
| aus | 20000 | 25000 |
I wrote condition like this =WildMatch(Concat(month,'/'),'Jan') but It does not work. pls tell me out how display straight table like above
Thankyou,
Regards
madhu
- Mark as New
- Bookmark
- Subscribe
- Mute
- Subscribe to RSS Feed
- Permalink
- Report Inappropriate Content
Thankyou massimo grossi.
- Mark as New
- Bookmark
- Subscribe
- Mute
- Subscribe to RSS Feed
- Permalink
- Report Inappropriate Content
if you get the answer, please close the discussion, thanks
- Mark as New
- Bookmark
- Subscribe
- Mute
- Subscribe to RSS Feed
- Permalink
- Report Inappropriate Content
Hi,
you already received two replies that answered your question to the point.
But just to make sure, that you are aware you are asking for a solution that lets a straight table imitate the function of a pivot table, another solution using a pivot instead of a straight table:
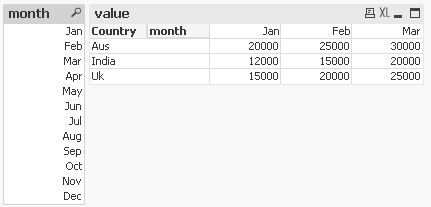
drag the month dimension to the top right corner.
Please let us know, if there are reasons you prefer a straight table instead.
hope this helps
regards
Marco
- Mark as New
- Bookmark
- Subscribe
- Mute
- Subscribe to RSS Feed
- Permalink
- Report Inappropriate Content
Thank you marco wedel.
- Mark as New
- Bookmark
- Subscribe
- Mute
- Subscribe to RSS Feed
- Permalink
- Report Inappropriate Content
VERY NICE SUNINDIA
- Mark as New
- Bookmark
- Subscribe
- Mute
- Subscribe to RSS Feed
- Permalink
- Report Inappropriate Content
Hello marco wedel.
I tried as it is what you said but It does not work. see my data.

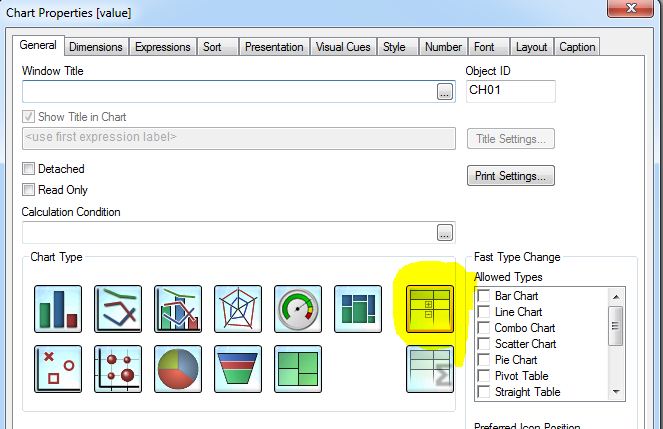
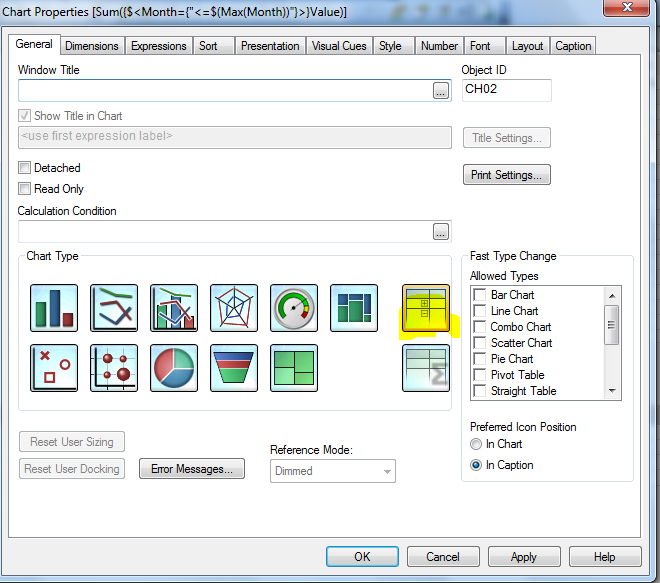
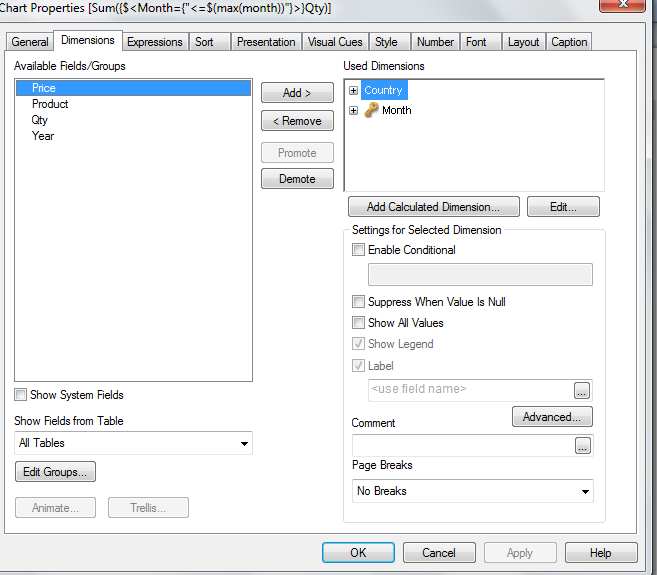
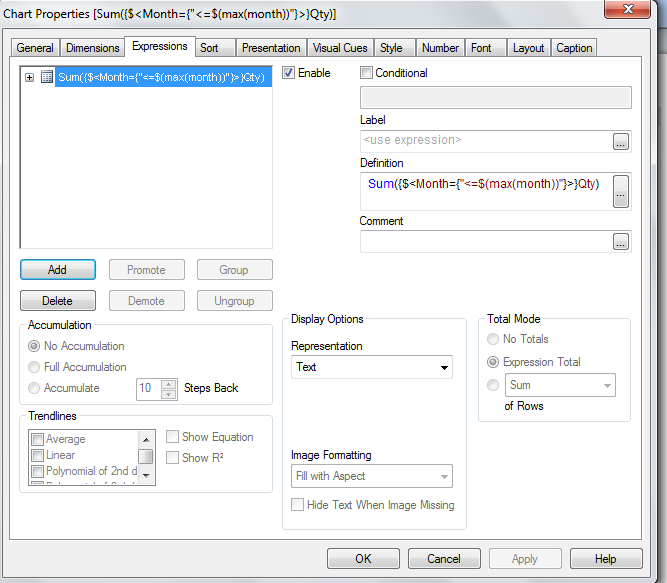
step1: I select pivot table
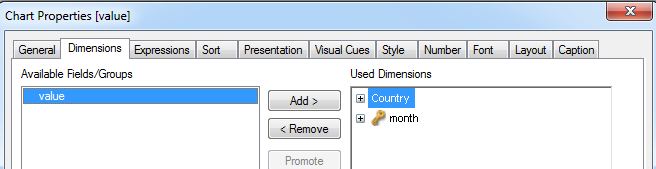
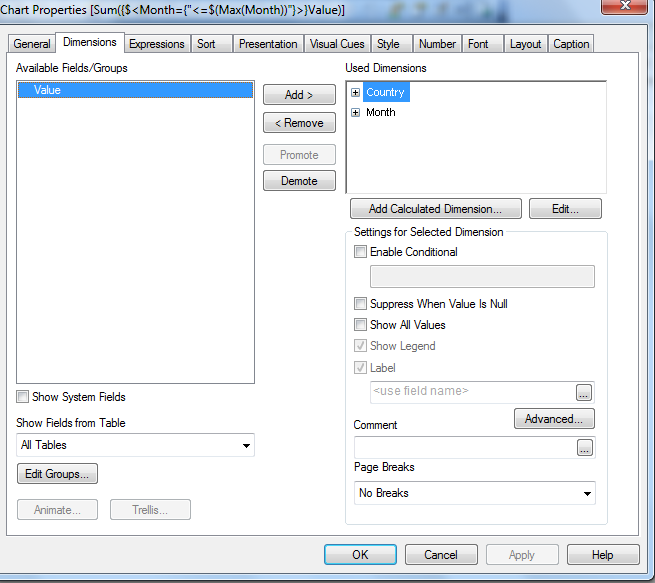
Step2: I take 2 dimensions
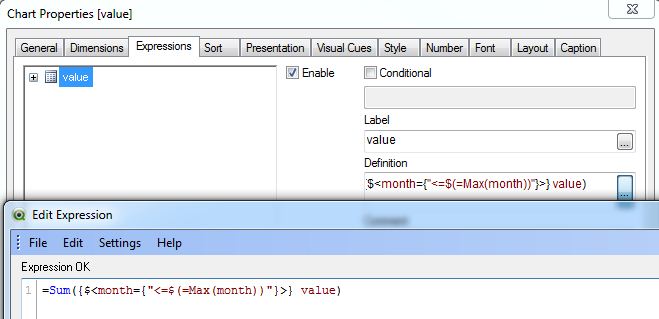
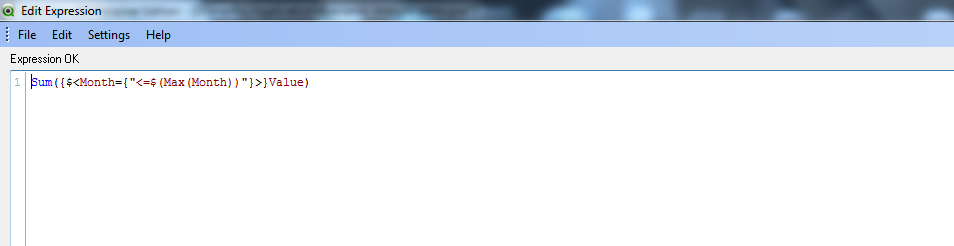
Step 3: I write expression in expression tab.

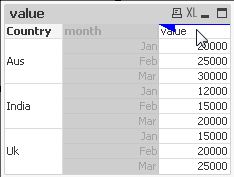
Step 4: I take this data
but when I select month in list box I doesnot work. see this image.
pls tell me marco wedel where did I do mistake .pls help me
Thankyou,
Regards
madhu
- Mark as New
- Bookmark
- Subscribe
- Mute
- Subscribe to RSS Feed
- Permalink
- Report Inappropriate Content
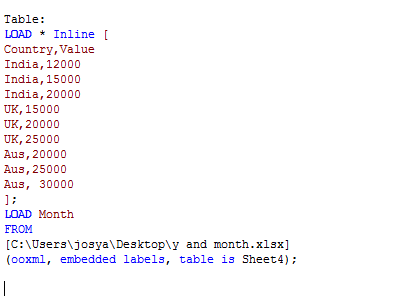
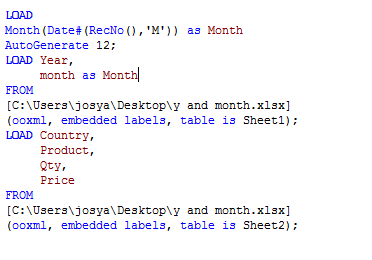
you did not load your months as dual values, i.e. there has to be an underlying numerical value to work properly.
Try to generate your months in the script e.g. like this
tabMonths:
LOAD Month(Date#(RecNo(),'M')) as month
AutoGenerate 12;
hope this helps
regards
Marco
- Mark as New
- Bookmark
- Subscribe
- Mute
- Subscribe to RSS Feed
- Permalink
- Report Inappropriate Content
Check this please its really solve your needs .
- Mark as New
- Bookmark
- Subscribe
- Mute
- Subscribe to RSS Feed
- Permalink
- Report Inappropriate Content
Thank you very much Marco wedel .thank you so much marco wedel .
- Mark as New
- Bookmark
- Subscribe
- Mute
- Subscribe to RSS Feed
- Permalink
- Report Inappropriate Content
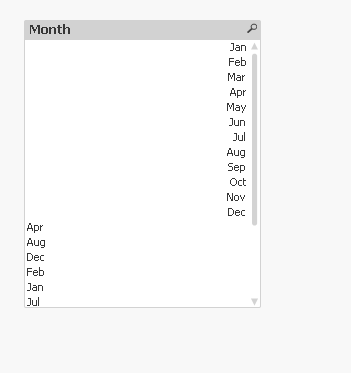
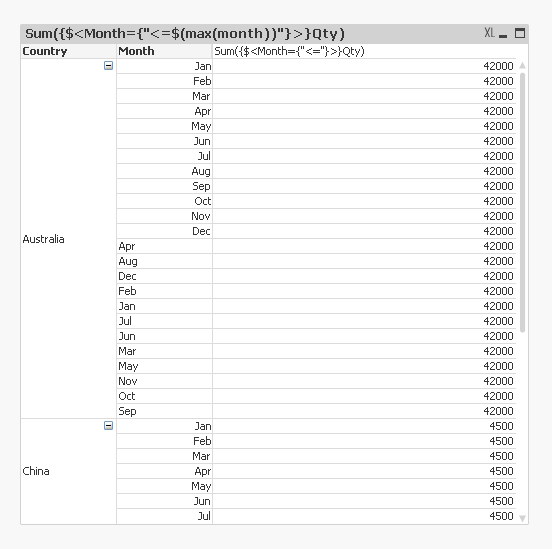
Hello Marco wedel.I followed your instructions but it is not work properly according to my selections. the data disply in pivot table like this .
List box:
Step1: pivot table
step2 :
Step3:
Script:
But it is not work properly . pls help me
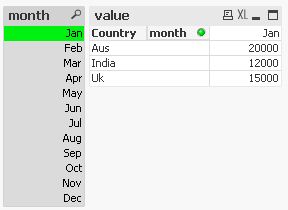
when I select feb It display only feb data.
Thankyou,
Regards
madhu